Show code cell source
import numpy as np
import pandas as pd
import matplotlib.pyplot as plt
import matplotlib.animation as animation
from matplotlib.animation import FuncAnimation
%matplotlib notebook
8.10. JNB Lab Solutions#
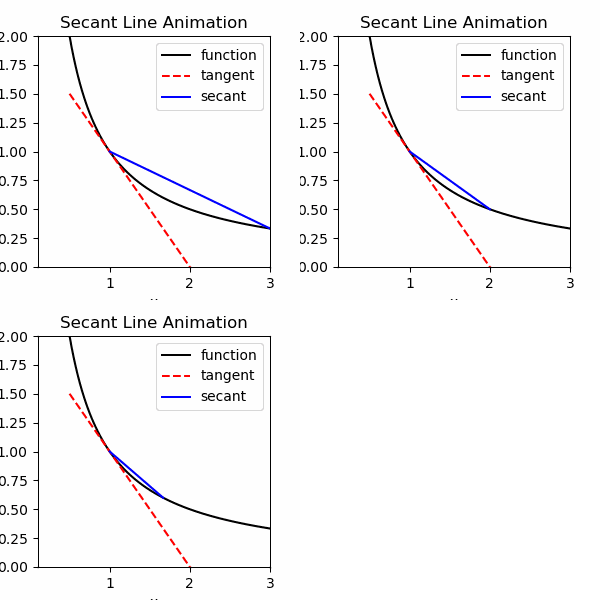
Exercise 1.1

Show code cell source
%matplotlib notebook
frames=3  # number of frames in the movie
# Define the function f(x)
f = lambda x : 1/x
a=1   #x coordinate of point of tangency
for n in range(frames):
    fig = plt.figure(figsize=(3,3))
    plt.xlim(.1,3)
    plt.ylim(0,2)
    #---plot the function f(x) in black---
    x = np.linspace(.5, 3, 100)
    y=f(x)
    plt.plot(x,y,color='k')
    #---plot the tangent line in red---
    y_tan= f(a)-(1/a**2)*(x-a)
    plt.plot(x,y_tan,'r--')
    #---plot the secant segment in blue---
    b=a+2/(n+1)
    x_sec=np.linspace(a, b, 50)
    y_sec= f(a) + (f(b) - f(a)) / (b - a) * (x_sec - a)
    plt.plot(x_sec,y_sec,color='b')
    # Set the x-axis and y-axis labels
    plt.xlabel('x')
    plt.ylabel('y')

    # Set the title
    plt.title('Secant Line Animation')

    # Set the legend
    plt.legend(['function','tangent','secant'])
    plt.savefig(str(n)+'.png')
    plt.show()

#----- Save the Animation as secant.gif-----
from PIL import Image
images = []
for n in range(frames):
    exec('a'+str(n)+'=Image.open("'+str(n)+'.png")')
    images.append(eval('a'+str(n)))
images[0].save('secant2.gif',
               save_all=True,
               append_images=images[1:],
               duration=1000,
               loop=0)
2.1

Show code cell source
import numpy as np
import pandas as pd
import matplotlib.pyplot as plt
import matplotlib.animation as animation
from matplotlib.animation import FuncAnimation
%matplotlib notebook
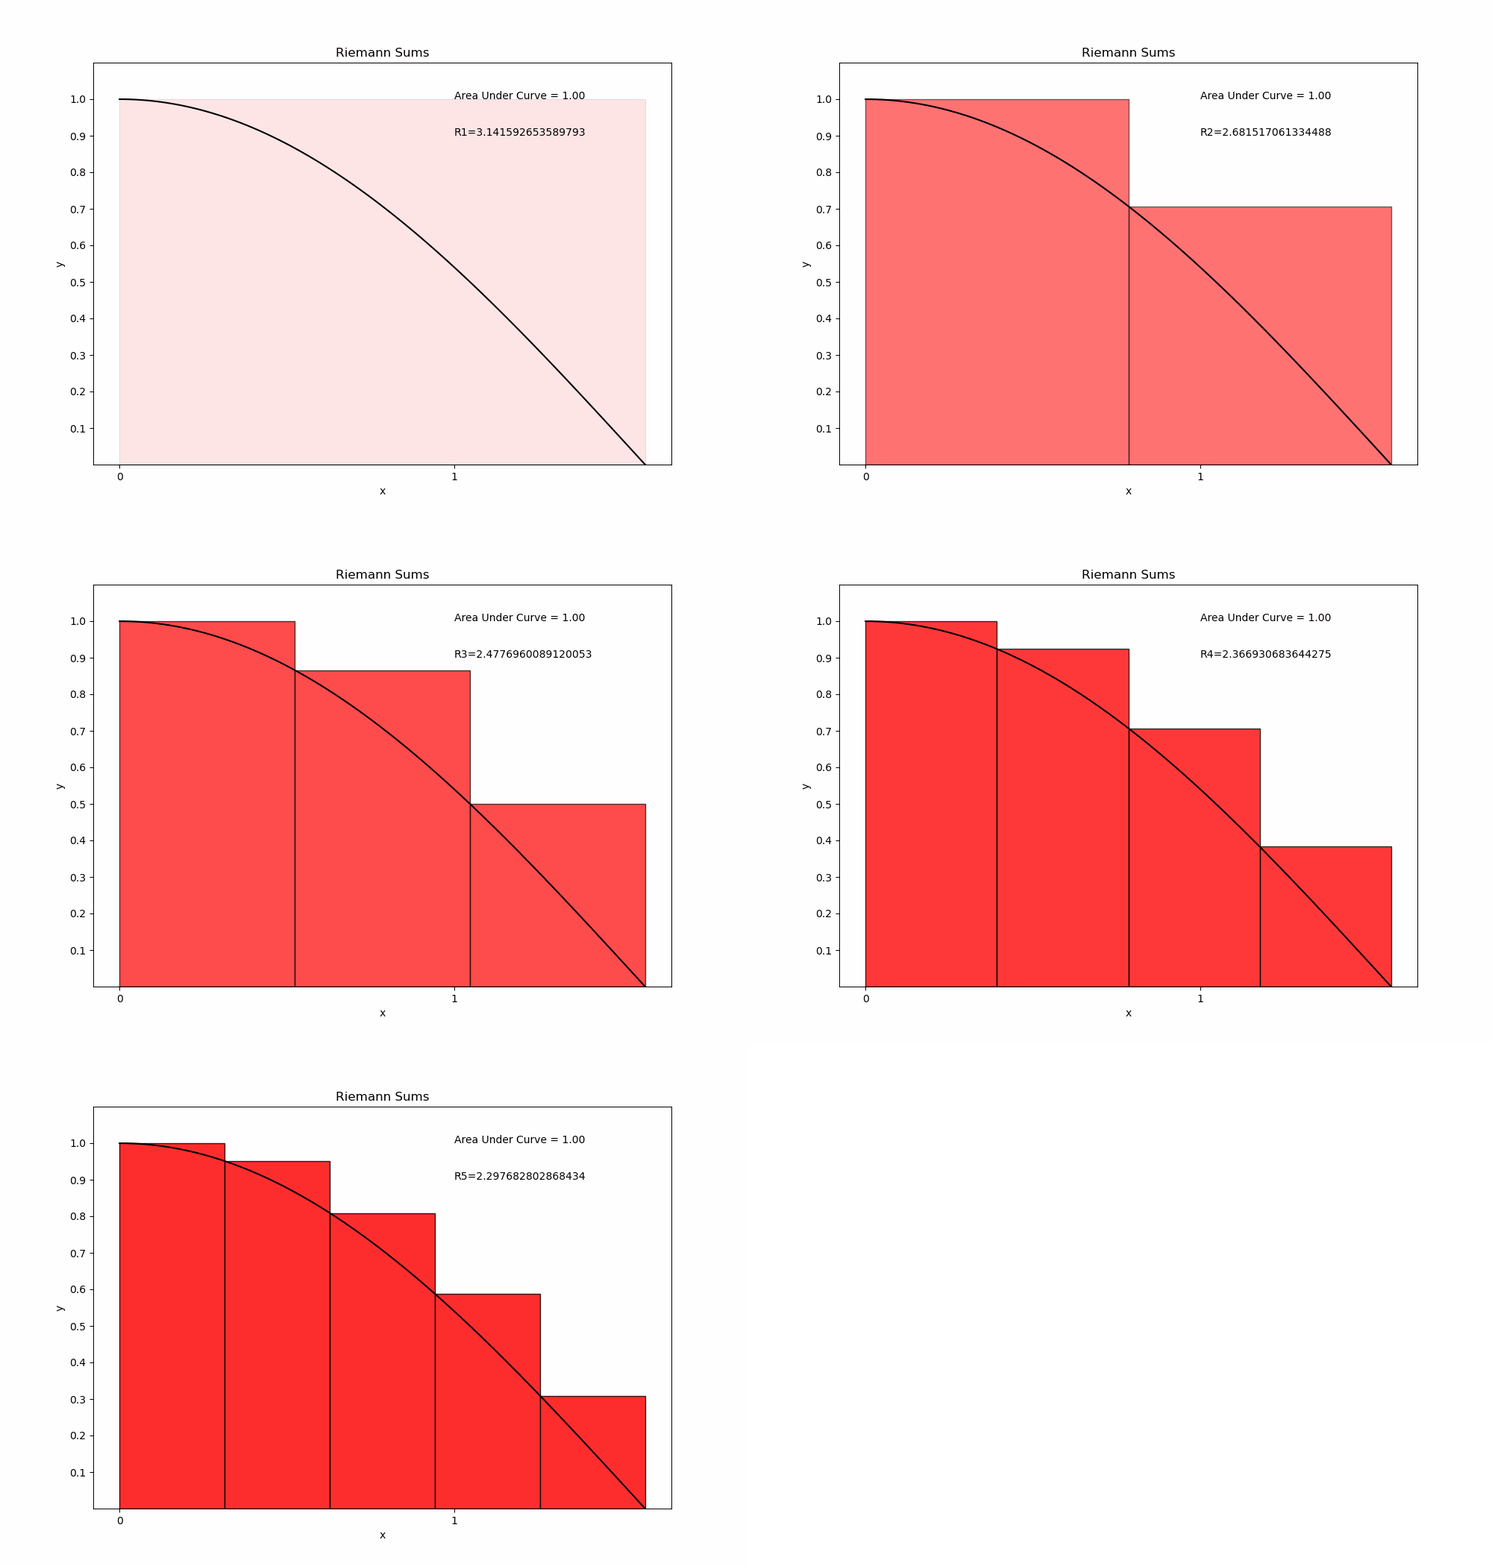
f = lambda x : np.cos(x)
x=np.linspace(0,np.pi/2,100)
y=f(x)
frames=5
for n in np.arange(0,frames,1):
    plt.figure(figsize=(10,7))
    plt.gca().set_xticks(np.arange(0,4,1))
    plt.gca().set_yticks([.1,.2,.3,.4,.5,.6,.7,.8,.9,1])
    plt.plot(x,y,'k',markersize=1)
    x_left = np.linspace(0,np.pi/2,n+2)
    x_left=x_left[:-1]
    plt.bar(x_left,np.cos(x_left),width=.5*np.pi/(n+1),alpha=1-.9*(1/(n+1)),align='edge',color='r',edgecolor='k')
    plt.title('Riemann Sums')
    plt.xlabel('x')
    plt.ylabel('y')
    plt.ylim((0,1.1))
    plt.text(1,1,"Area Under Curve = 1.00")
    Rn=0
    for k in np.arange(0,n+1,1):
        Rn=Rn+(np.pi/(n+1))*np.cos(x_left[k])
    plt.text(1,.9, "R"+str(n+1)+"="+str(Rn))
    #plt.grid()
    plt.savefig(str(n)+'.png')
    plt.show()
#----- Save the Animation as riemannsums.gif
from PIL import Image
images = []
for n in range(frames):
    exec('a'+str(n)+'=Image.open("'+str(n)+'.png")')
    images.append(eval('a'+str(n)))
images[0].save('riemannsums2.gif',
               save_all=True,
               append_images=images[1:],
               duration=800,
               loop=0)
3.1

Show code cell source
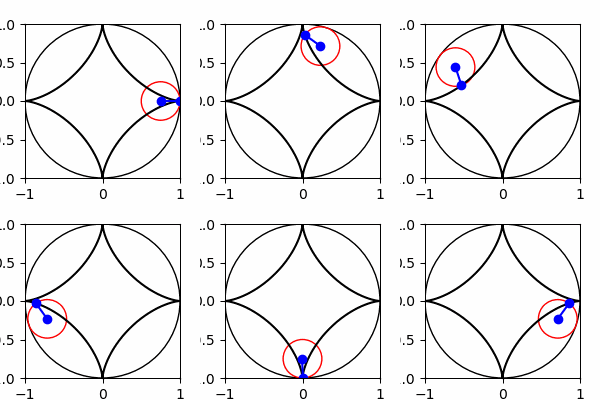
a=1
b=.25
r=a-b
%matplotlib notebook
frames=20
for n in range(frames):
    fig = plt.figure(figsize=(2, 2))
    plt.xlim(-1,1)
    plt.ylim(-1,1)
    #---Plot the Outer Circle--------
    circle = plt.Circle((0,0),1,color='k',fill=False)
    plt.gca().add_artist(circle)
    #---Plot the Hypocycloid--------
    t = np.arange(0, 2*np.pi, 0.001)
    alpha=(a-b)*t/b
    xt=r*np.cos(t)+b*np.cos(alpha)
    yt=r*np.sin(t)-b*np.sin(alpha)
    plt.gca().plot(xt, yt,color='k')
    #Plot the  spoke from the center to the rim of the wheel
    theta=2*np.pi*n/frames
    alpha=(a-b)*theta/b
    plt.gca().plot([r*np.cos(theta)+b*np.cos(alpha),r*np.cos(theta)],[r*np.sin(theta) - b*np.sin(alpha),r*np.sin(theta)] , 'bo-')
    #----Plot the Wheel-----------
    circle = plt.Circle((r*np.cos(theta), r*np.sin(theta)), b,color='r',fill=False)
    plt.gca().add_artist(circle)
    plt.savefig(str(n)+'.png')
    plt.show()
#----- Save the Animation as hypocycloid.gif
from PIL import Image
images = []
for n in range(frames):
    exec('a'+str(n)+'=Image.open("'+str(n)+'.png")')
    images.append(eval('a'+str(n)))
images[0].save('hypocycloid.gif',
               save_all=True,
               append_images=images[1:],
               duration=300,
               loop=0)
C:\Users\pisihara\AppData\Local\Temp\ipykernel_19208\169837878.py:7: RuntimeWarning: More than 20 figures have been opened. Figures created through the pyplot interface (`matplotlib.pyplot.figure`) are retained until explicitly closed and may consume too much memory. (To control this warning, see the rcParam `figure.max_open_warning`). Consider using `matplotlib.pyplot.close()`.
  fig = plt.figure(figsize=(2, 2))

