Show code cell source
import numpy as np
import pandas as pd
import matplotlib.pyplot as plt
import matplotlib.animation as animation
from matplotlib.animation import FuncAnimation
%matplotlib notebook
8.9. JNB LAB: Calculus Animations#
In this JNB, we will show how to create animations that illustrate basic calculus concepts. To create an animation, we use a for loop to create single frames of the animation ‘0.png’, ‘1.png’, ‘2.png’,…. and then use a block of code to combine the individual frames into a .gif animation.
8.9.1. Tangent Lines#
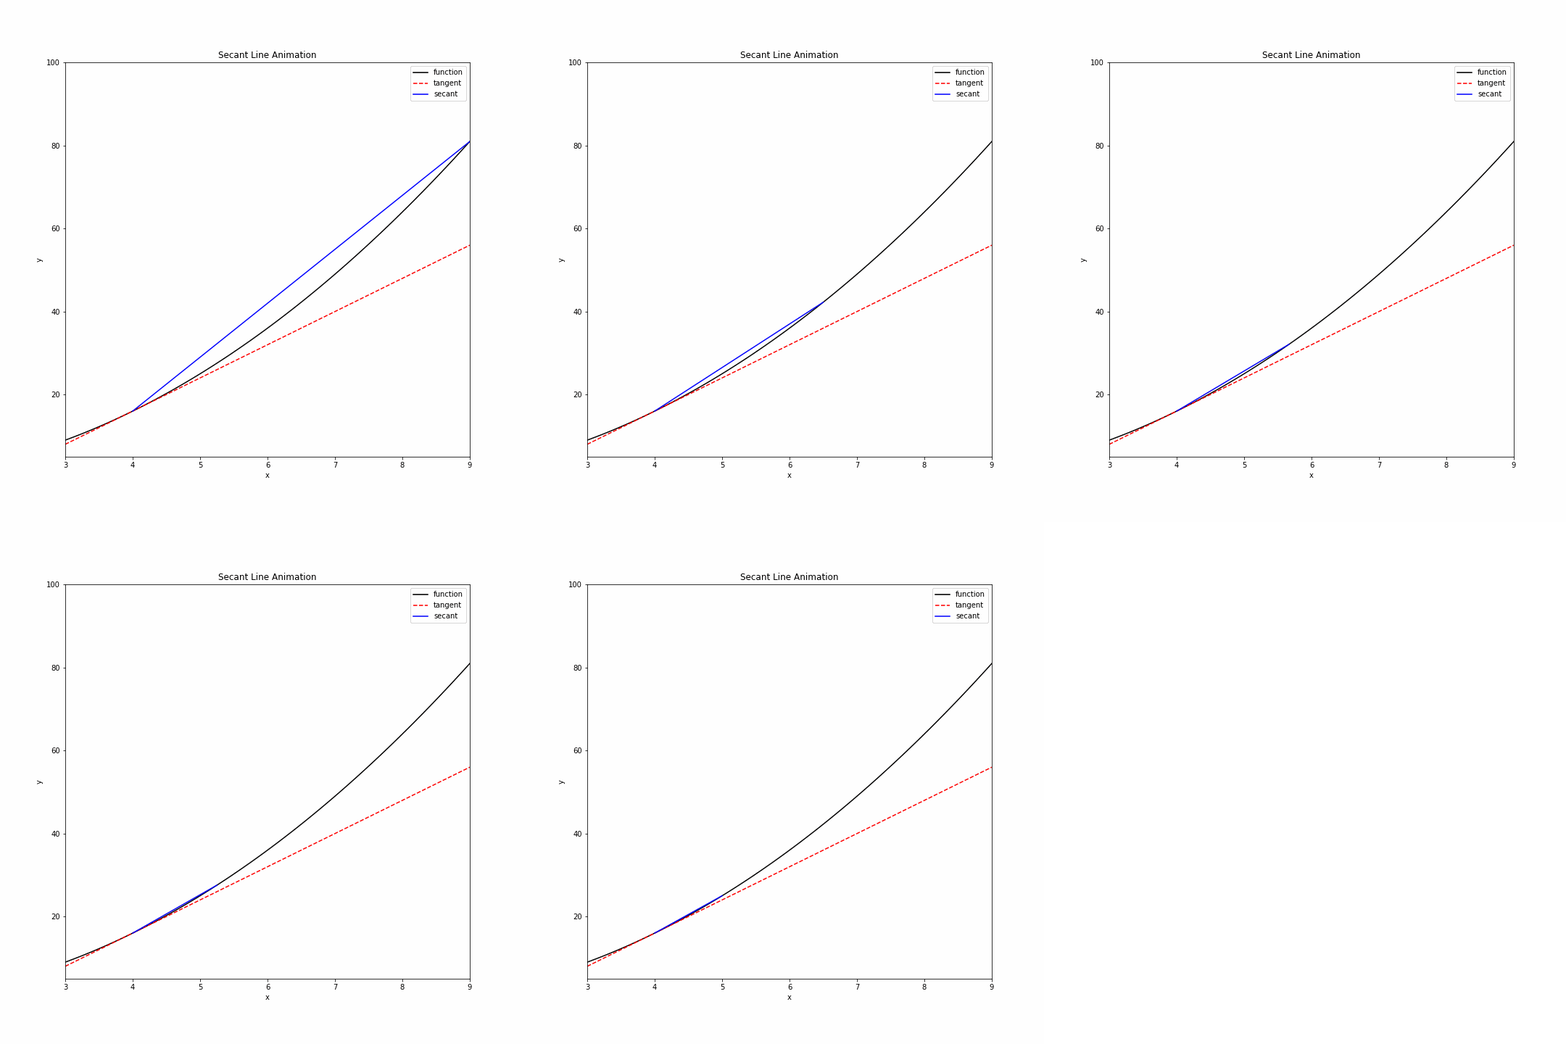
Let’s begin by showing how secants approach a tangent line. We will use the function \(f(x)=x^2\) and create a sequence of secants that approach the tangent line at point \(x=4\).

First, let’s define our function and specify the point of tangency.
f = lambda x : x**2 # Define the function f(x)
a=4   #x coordinate of point of tangency
Now let’s create the first frame (\(n=0\)) of the sequence of images \(\{n.png\}\) used to create the animation.
Show code cell source
n=0

#---set the figure specs
fig = plt.figure(figsize=(5,5))
plt.xlim(3,9)
plt.ylim(5,100)
#---plot the function f(x) in black---
x = np.linspace(3, 9, 100)
y=f(x)
plt.plot(x,y,color='k')
#---plot the tangent line in red---
y_tan= f(a)+2*a*(x-a)
plt.plot(x,y_tan,'r--')
#---plot the secant segment in blue---
b=a+5/(n+1)
x_sec=np.linspace(a, b, 50)
y_sec= f(a) + (f(b) - f(a)) / (b - a) * (x_sec - a)
plt.plot(x_sec,y_sec,color='b')
# Set the x-axis and y-axis labels
plt.xlabel('x')
plt.ylabel('y')

# Set the title
plt.title('Secant Line Animation')

# Set the legend
plt.legend(['function','tangent','secant'])

# Save the figure
plt.savefig(str(n)+'.png')
plt.show()
To create our animation, we will:
i) import a couple of functions used to create the animation
ii) specify the number of frames
iii) specify our function and point of tangency (assuming we haven’t done so previously)
iv) use a for loop to create the individual frames in the animation
v) combine the frames into an animation file “secant.gif” which is found in the same folder as this lab.
Show code cell source
# i) import functions

import matplotlib.animation as animation
from matplotlib.animation import FuncAnimation
%matplotlib notebook

# ii) specify the number of frames
frames=5

# iii) specify the function f(x) and poit of tangency
f = lambda x : x**2
a=4   #x coordinate of point of tangency

# iv) use a for loop to create the individual frames
for n in range(frames):
    fig = plt.figure(figsize=(3,3))
    plt.xlim(3,9)
    plt.ylim(5,100)
    #---plot the function f(x) in black---
    x = np.linspace(3, 9, 100)
    y=f(x)
    plt.plot(x,y,color='k')
    #---plot the tangent line in red---
    y_tan= f(a)+2*a*(x-a)
    plt.plot(x,y_tan,'r--')
    #---plot the secant segment in blue---
    b=a+5/(n+1)
    x_sec=np.linspace(a, b, 50)
    y_sec= f(a) + (f(b) - f(a)) / (b - a) * (x_sec - a)
    plt.plot(x_sec,y_sec,color='b')
    # Set the x-axis and y-axis labels
    plt.xlabel('x')
    plt.ylabel('y')

    # Set the title
    plt.title('Secant Line Animation')

    # Set the legend
    plt.legend(['function','tangent','secant'])
    plt.savefig(str(n)+'.png')
    plt.show()

# v) combine the frames into an animation file secant.gif
from PIL import Image
images = []
for n in range(frames):
    exec('a'+str(n)+'=Image.open("'+str(n)+'.png")')
    images.append(eval('a'+str(n)))
images[0].save('secant.gif',
               save_all=True,
               append_images=images[1:],
               duration=1000,
               loop=0)
Exercise#
Exercise
1.1 Create an animation with 3 frames which shows secants approaching the tangent line to \(y=\frac{1}{x}\) at \(x=1\).
8.9.2. Riemann Sums#
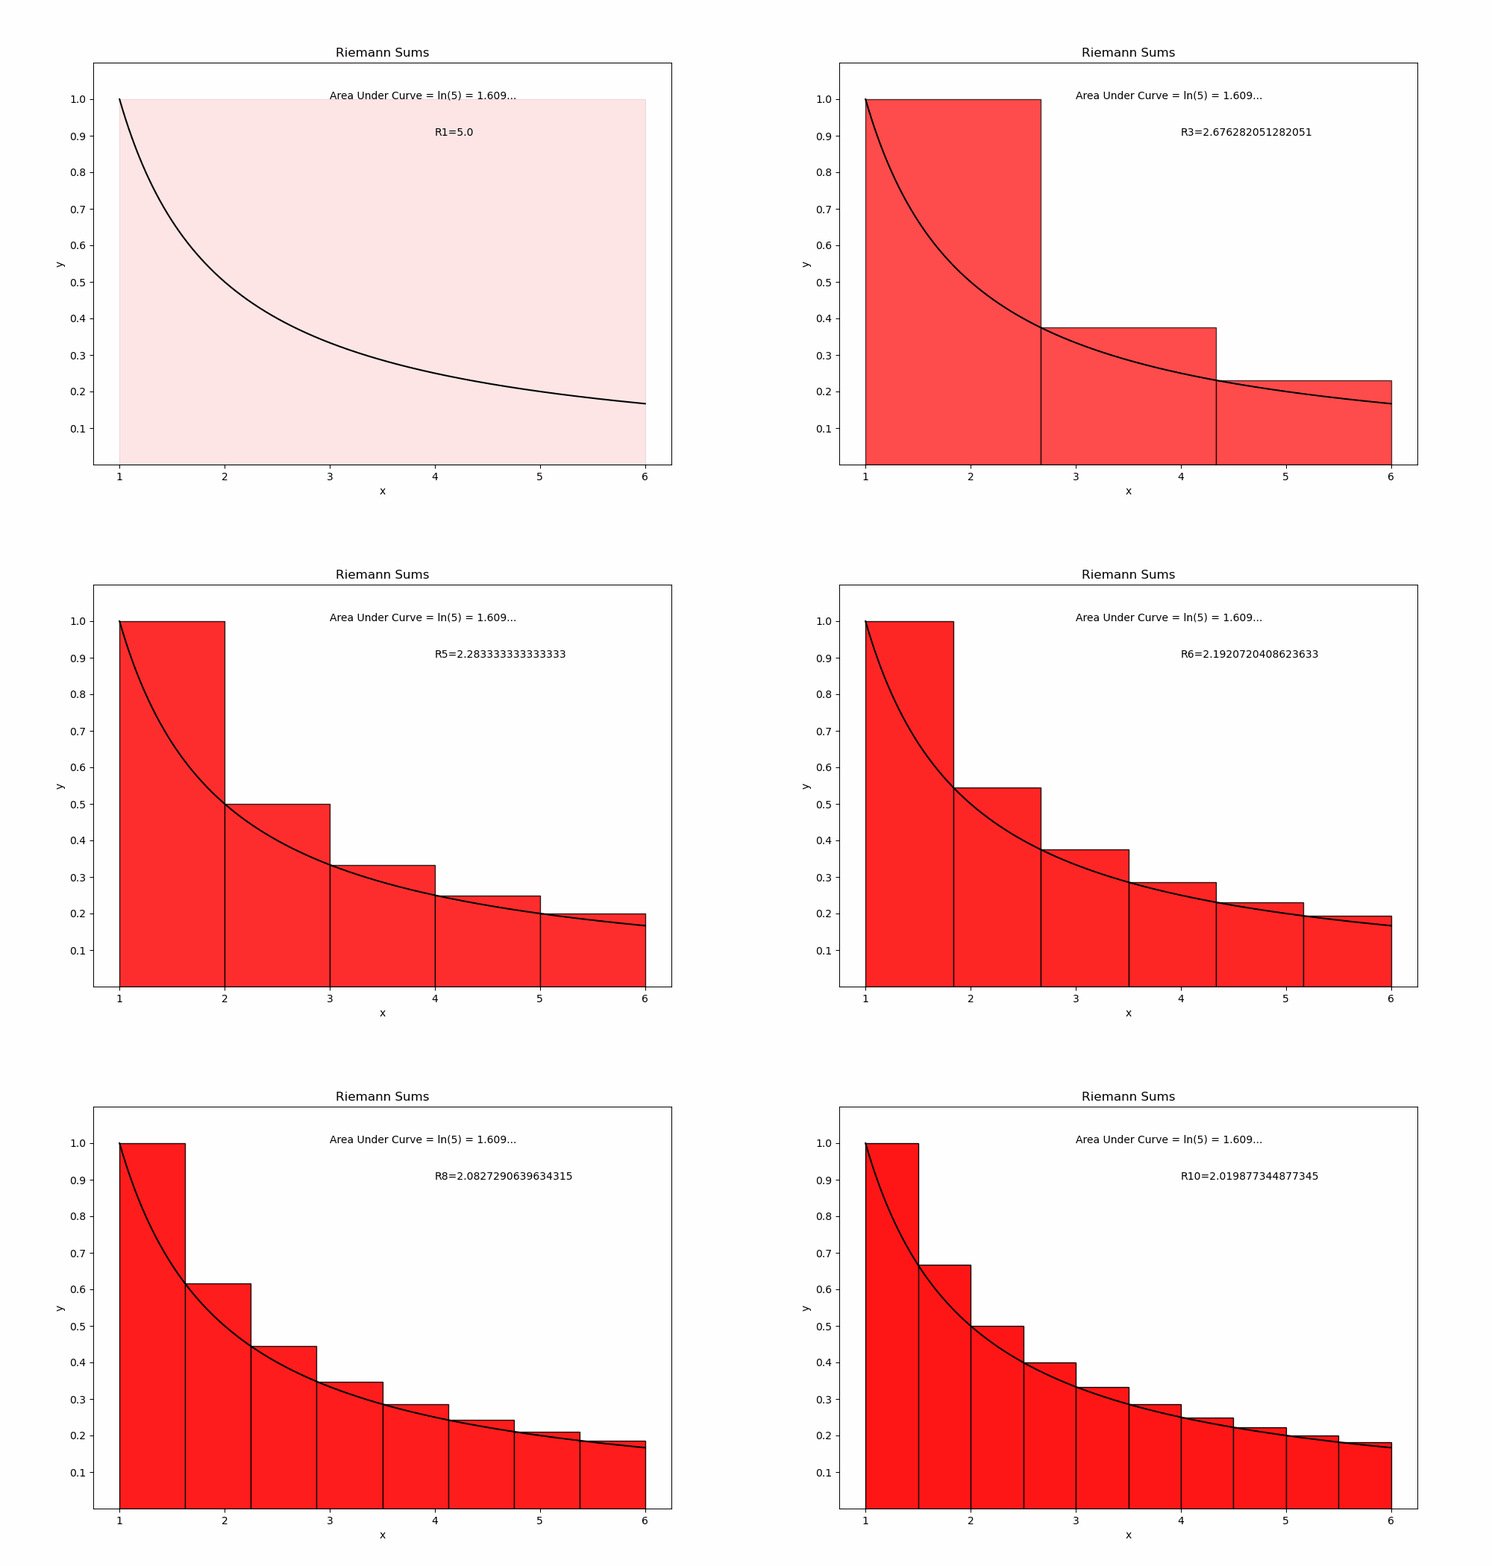
Just as the tangent line is obtained by a limiting process, the area under curve is obtainable as a limit of a Riemann Sum. We can create an animation which shows the approximating rectangles filling in the area under a curve. For example, we consider the area under \(y=1/x\) in the interval \(1\le x \le 5\).

import numpy as np
import pandas as pd
import matplotlib.pyplot as plt
import matplotlib.animation as animation
from matplotlib.animation import FuncAnimation
%matplotlib notebook
f = lambda x : 1/x
x=np.arange(1,6,.0001)
y=f(x)
frames=10
for n in np.arange(0,frames,1):
    plt.figure(figsize=(10,7))
    plt.gca().set_xticks(np.arange(1,7,1))
    plt.gca().set_yticks([.1,.2,.3,.4,.5,.6,.7,.8,.9,1])
    plt.plot(x,y,'k',markersize=1)
    x_left = np.linspace(1,6,n+2)
    x_left=x_left[:-1]
    plt.bar(x_left,1/x_left,width=5/(n+1),alpha=1-.9*(1/(n+1)),align='edge',color='r',edgecolor='k')
    plt.title('Riemann Sums')
    plt.xlabel('x')
    plt.ylabel('y')
    plt.ylim((0,1.1))
    plt.text(3,1,"Area Under Curve = ln(5) = 1.609...")
    Rn=0
    for k in np.arange(0,n+1,1):
        Rn=Rn+(5/(n+1))*(1/x_left[k])
    plt.text(4,.9, "R"+str(n+1)+"="+str(Rn))
    #plt.grid()
    plt.savefig(str(n)+'.png')
    plt.show()
#----- Save the Animation as riemannsums.gif
from PIL import Image
images = []
for n in range(frames):
    exec('a'+str(n)+'=Image.open("'+str(n)+'.png")')
    images.append(eval('a'+str(n)))
images[0].save('riemannsums.gif',
               save_all=True,
               append_images=images[1:],
               duration=800,
               loop=0)
Exercise#
Exercise
2.1 Create an animation for a Riemann sum approximation of \(\int_0^{\pi/2}\cos(x)\,dx\).
8.9.3. Parametric Curves#
JNBs can be used to create .gif animations of parametric curves. For example, the code below is used to animate a cycloid curve traced by a point on the rim of a wheel.

Show code cell source
import numpy as np
import pandas as pd
import matplotlib.pyplot as plt
import matplotlib.animation as animation
from matplotlib.animation import FuncAnimation
%matplotlib notebook
frames=50
for n in range(frames):
    fig = plt.figure(figsize=(15, 2))
    plt.gca().axis([-np.pi, 2*np.pi, 0, 1.2])
    #---Plot the Cycloid--------
    t = np.arange(0, 2*np.pi, 0.001)
    xt=t/2-.5*np.sin(t)
    yt=.5-.5*np.cos(t)
    plt.gca().plot(xt, yt,color='k')
    #----Plot the Wheel-----------
    circle = plt.Circle((np.pi*n/frames, 0.5), 0.5,color='r',fill=False)
    plt.gca().add_artist(circle)
    #Plot the point on the rim of the wheel
    plt.gca().plot(np.pi*n/frames -.5*np.sin(2*np.pi*n/frames), .5-.5*np.cos(2*np.pi*n/frames), 'bo')
    plt.savefig(str(n)+'.png')
    plt.close()

#----- Save the Animation as cycloid.gif
from PIL import Image
images = []
for n in range(frames):
    exec('a'+str(n)+'=Image.open("'+str(n)+'.png")')
    images.append(eval('a'+str(n)))
images[0].save('cycloid.gif',
               save_all=True,
               append_images=images[1:],
               duration=300,
               loop=0)
Exercise#
Exercise
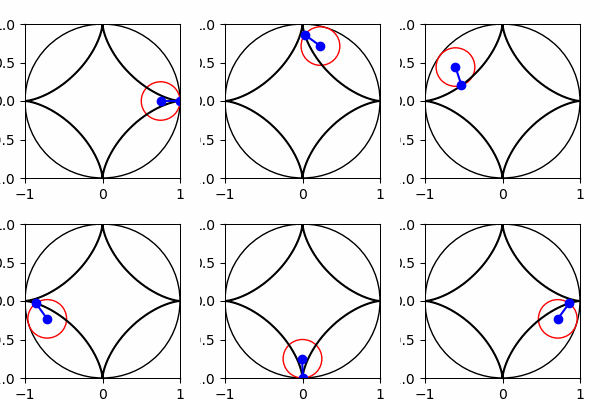
3.1 A hypocycloid curve is formed by a point on a circle rotating along the inside rim of another circle. The parametric equations are
\(x(t) = (a-b) \cos t + b \cos(\frac{a-b}{b}t)\)
\(y(t) = (a-b) \sin t - b \sin(\frac{a-b}{b}t)\)
Create an animation of a hypocycloid curve for the case \(a=1\), \(b=1/4\). Your animation should resemble the one shown below.


