import numpy as np
import matplotlib.pyplot as plt
from scipy.integrate import odeint
12.3. The Basic SIR Model#
12.3.1. Introduction#
The SIR model is a system of three ordinary differential equations that describe the dynamics over time \(t\) of the number of susceptible, number of infected, and number of recovered individuals during an epidemic.
Basic SIR Model
where
\(S(t)\) the number of susceptible individuals,
\(I(t)\) is the number of infected individuals,
\(R(t)\) is number of recovered individuals.
The parameter \(\beta>0\) is called the transmission rate, and the parameter \(\gamma>0\) is the recovery rate. (See Fig. 12.1.)
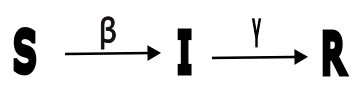
Fig. 12.1 Schematic diagram of transitions.#
The differential equations are
Change in Susceptibles Equation (12.1)
The number of susceptibles (\(S\)) decreases with time at a rate proportional to the number of encounters \(S I\) between susceptibles and infected (with a constant of proportionality \(\beta\)).
Change in Infected Equation (12.2)
The number of infected \(I\) is increasing with respect to time \(t\), proportional to the number of encounters \(S I\) between susceptibles and infected (with a constant of proportionality \(\beta\)) and decreasing proportional to the number of infected \(I\) present (with a constant of proportionality \(\gamma\))
Change in Recovered Equation (12.3)
The number of recovered \(R\) is increasing at a rate proportional to the number of infected \(I\) (with a constant of proportionality \(\gamma\).)
12.3.2. Numerical Solutions#
We now show how to use an ODE solver to obtain graphs of the solutions \(S(t)\), \(I(t)\) and \(R(t)\) for the following parameter values and initial conditions:
PARAMETER VALUES
\(\beta\) (transmission_rate) = 0.000001
\(\gamma\) (recovery_rate) = 0.2.
INITIAL CONDITIONS
\(S_0 = 1,000,000\) (Initial number of susceptibles)
\(I_0 = 1\) (Initial number of infected)
\(R_0 = 0\) (initial number of recovered)
# Define Equations
def f(y, t, params):
    S, I, R = y      # unpack current values of y
    beta, gamma      # unpack parameters
    #specify dS/dt, dI/dt and dR/dt
    derivs = [-beta * S * I,
             beta * S * I - gamma * I,
             gamma * I]
    return derivs

# Parameters
beta=.000001
gamma=.2
# Initial values
S0=1000000
I0=1
R0=0

# Bundle parameters for ODE solver
params = [beta,gamma]
# Bundle initial conditions for ODE solver
y0 = [S0,I0,R0]

# Make time array for solution
tStop = 70  # number of days
tInc = .001
t = np.arange(0., tStop, tInc)

# Call the ODE solver
psoln = odeint(f, y0, t, args=(params,))

# Plot results
fig = plt.figure(1, figsize=(5,3))
plt.plot(t, psoln[:,0],label='susceptible')
plt.plot(t, psoln[:,1],label='infected')
plt.plot(t, psoln[:,2],label='recovered')
plt.legend()
plt.xlabel('day')
plt.ylabel('number')
plt.savefig("SIR.png")
plt.tight_layout()
plt.show()
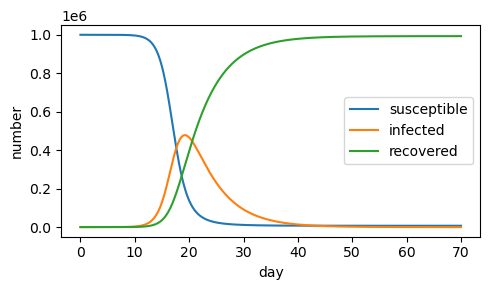
Note that the transmission rate is sufficiently low that allows for a full recovery of the population (end of epidemic) by roughly day 40.
12.3.3. Exercises#
Exercises
Investigate how the parameter change affects the disease progression.
(a) What happens if you change the population to a smaller or a larger number? For instance, if you change the population (initial S) to 3,000,000, will the epidemic be over sooner or later? What happens if the population is 1000?
(b) What happens if you change the transmission rate? For instance, if the transmission rate is high, e.g. 0.0001, what do you observe from the curves in the epidemic model? What happens if the transmission rate is lower, e.g. \( 10^{-7} \) ?
(c) Does the recovery rate play a role in the epidemic model? If so, how does the recovery rate contribute to the disease progression? Show your adjustments of the recovery rate and their related results.
(d) According to your observations, do you think all people can potentially be infected by the disease? Explain your answer.
(e) Is it possible, based on some initial conditions and parameter values, that there is no disease outbreak? Explain your answer.
Consider a modification of the SIR model called the SIRV model for the mathematical modeling of epidemics, where V is the number of vaccinated individuals, and the parameter v>0 is the given constant vaccination rate. The goal is to solve for S(t), I(t), R(t), and V(t). Model and simulate the populations levels S, I, R, and V and interpret the results for this model as above.
In the model, change the equation with dS/dt to convey that not only does the number of susceptibles decrease proportionally to the number of encounters S*I between susceptibles and infected (with a constant of proportionality \(\beta\)), but it also decreases proportionally to the number of vaccinated individuals V present (with a constant of proportionality v). Also, add an equation to convey that the number of vaccinated individuals increases proportionally to the number of susceptibles present (with a constant of proportionality v). Draw a schematic diagram to summarize the movement of people between the compartments S, I, R, and V for the population in this model.
Consider a modification of the SIR model called the SIRD model for the mathematical modeling of epidemics, where D is the number of individuals who have died, and the parameter \(\mu>0\) is the given constant mortality rate. The goal is to solve for S(t), I(t), R(t), and D(t). Our new model will simulate the populations levels S, I, R, and D. Visualize and interpret the results for this model as above.
In the SIR model, change the equation with dI/dt to convey that not only does the number of infected increase proportionally to the number of encounters S*I between susceptibles and infected (with a constant of proportionality \(\beta\)) and decrease proportionally to the number of infected individuals I present (with a constant of proportionality \(\gamma\)), but the number of infectives also decreases proportionally to the number of infectives I present (with a constant of proportionality of the mortality rate \(\mu\)). Also, add an equation to convey that the number of individuals who have died increases proportionally to the number of infected (with a constant of proportionality \(\mu\)). Draw a schematic diagram to summarize the movement of people between the compartments S, I, R, and V for the population in this model.