2.6. Solution to Exercises#
2.6.1. Beginning Python Programming#
pandas
# 1) Create your own data file with some interesting info.
#    Read in the data into a dataframe  called df using pd.read_excel().
import pandas as pd
df=pd.read_excel("sugar.xlsx")
# 2) Display the first row of df
df.head(1)
| Food | Grams of Sugar | Recommended Daily Limit (25 grams) | |
|---|---|---|---|
| 0 | BK Chocolate Shake | 112 | 4x daily limit |
# 3) Abbreviate the column names.
df.columns=["food", "sugar(gm)","daily limit"]
# 4) Display the first line
df.head(1)
| food | sugar(gm) | daily limit | |
|---|---|---|---|
| 0 | BK Chocolate Shake | 112 | 4x daily limit |
# 5) Show how to use .loc() to get a particular entry in your dataframe.
df.loc[0,"sugar(gm)"]
112
for loops
Show code cell source
import numpy as np
list1=np.arange(0,12,2)
print("list 1=", list1)
def addone(list1):
    for i in list1:
        print(i+1)
    return print("Mission Accomplished!")

addone(list1)
list 1= [ 0  2  4  6  8 10]
1
3
5
7
9
11
Mission Accomplished!
If conditional statements
Show code cell source
list2=np.arange(0,22,2)
print("list2=",list2)

def halve_upper_half(list2):
    for i in list2:
        if i>10:
            print(i/2)
    return

halve_upper_half(list2)
list2= [ 0  2  4  6  8 10 12 14 16 18 20]
6.0
7.0
8.0
9.0
10.0
Dataframes
Show code cell source
import pandas as pd
import numpy as np
rawCOVID = pd.read_json('https://data.cityofchicago.org/resource/yhhz-zm2v.json?$limit=100000') #Import data directly from data portal
COVID=rawCOVID[['deaths_cumulative', "population",  'tests_cumulative','zip_code']]
COVID.dropna  #drop rows with missing data
COVID.columns=["deaths","population","tests","zip"] #simplify the column names
Show code cell source
def MyCOVID2(COVID,zipcode):
    alreadychecked=0  #eliminate duplication of information
    for z in COVID.index:  #go through all the index values
        if COVID.loc[z,"zip"]==zipcode and alreadychecked==0:    #found the zip we requested (first-time)
            alreadychecked=1  #we will only do this once
            df=COVID[COVID["zip"]==zipcode]
            numtested=df["tests"].max()
            numdeaths=df["deaths"].max()
            numpopulation=df["population"].max()
            print("Zip code: ", COVID.loc[z,"zip"])
            print("population is ", numpopulation)
            print("number tested is ", numtested)
            print("number deaths ", numdeaths)
            print("population is ", numpopulation)
    return ("Enter a different zip code if you wish.")
MyCOVID2(COVID,'60637')
Zip code:  60637
population is  47454
number tested is  416617
number deaths  107
population is  47454
'Enter a different zip code if you wish.'
2.6.2. Glimpse of Chicago#
Predicting Exemplary Schools
Show code cell source
import pandas as pd
import numpy as np
import matplotlib.pyplot as plt
df=pd.read_excel("MiddleSchool.xlsx")

#---PREDICTION MODEL----#
def mypredict(df):
    for i in df.index:
        if (df.loc[i,"Teacher Retention Rate"]>=85 and df.loc[i,"Student Attendance Rate"]>=95 and df.loc[i,"# Student Enrollment"]<=267 and df.loc[i,"Student Chronic Truancy Rate"]<=2.9  and df.loc[i,"Teacher Retention Rate"]>=90.6) :
            df.loc[i,"Prediction"]=1
        else:
            df.loc[i,"Prediction"]=0
    return df

#---APPLY MODEL TO OUR DATA---#
mydf=mypredict(df)
mydf=mydf.reset_index(drop=True)

#---COMPUTE YOUR SCORE---#
TP=0
TN=0
FP=0
FN=0
numschools=0
for i in mydf.index:
    if mydf.loc[i,"Prediction"]==1 and mydf.loc[i,"Summative Designation"]=="Exemplary":
        TP=TP+1
    if mydf.loc[i,"Prediction"]==0 and mydf.loc[i,"Summative Designation"]!="Exemplary":
        TN=TN+1
    if mydf.loc[i,"Prediction"]==1 and mydf.loc[i,"Summative Designation"]!="Exemplary":
        FP=FP+1
    if mydf.loc[i,"Prediction"]==0 and mydf.loc[i,"Summative Designation"]=="Exemplary":
        FN=FN+1
    numschools=numschools+1
print("|TP|=",TP)
print("|TN|=",TN)
print("|FP|=",FP)
print("|FN|=",FN)
accuracy=round((TP+TN)/numschools,2)
precision=round(TP/(TP+FP),2)
recall=round(TP/(TP+FN),2)
F1score=2*(precision*recall)/(precision+recall)
print("Accuracy (% correct all 122 schools)=",100*accuracy,"%")
print("Precision (% correct of those you predicted to be exemplary) =",100*precision,"%")
print("Recall (% correct of schools that are exemplary) =",100*recall,"%")
print('COMPETITION F1 SCORE=',round(F1score*100,2),"%" )
|TP|= 4
|TN|= 113
|FP|= 3
|FN|= 2
Accuracy (% correct all 122 schools)= 96.0 %
Precision (% correct of those you predicted to be exemplary) = 56.99999999999999 %
Recall (% correct of schools that are exemplary) = 67.0 %
COMPETITION F1 SCORE= 61.6 %
Great Migration
Show code cell source
migration=pd.read_excel('migration.xlsx')
migdf=migration
migdf.columns=["City","Mig2","Mig1"]
migdf["city"]="city"  #create a column for the city
migdf["state"]="state"  #create a column for the state
for m in migdf.index:
    x=migdf.loc[m,"City"].split(", ")  #split the city from the state
    migdf.loc[m,"city"]=x[0]  #add the city to the city column
    migdf.loc[m,"state"]=x[1]  #add the state to the state column
migdf.drop(['City'], axis=1, inplace=True) #Drop the original City column
migdf=migdf.set_index(["city","state"],drop=True) #create multi-index
rawlatlon=pd.read_excel("uscities.xlsx") #read data
latlon=rawlatlon[["city_ascii","lat","lng","state_id"]] #select columns
latlon.columns=["city","lat","lon","state"] #rename columns
latlon=latlon.set_index(["city","state"],drop=True) #create multi-index
df=pd.merge(latlon,migdf, how='inner', left_index=True,right_index=True)
df.columns=["lat","lon","Mig2","Mig1"]
df=df[df["Mig1"]!="No data"]
df=df[df["Mig2"]!="No data"]
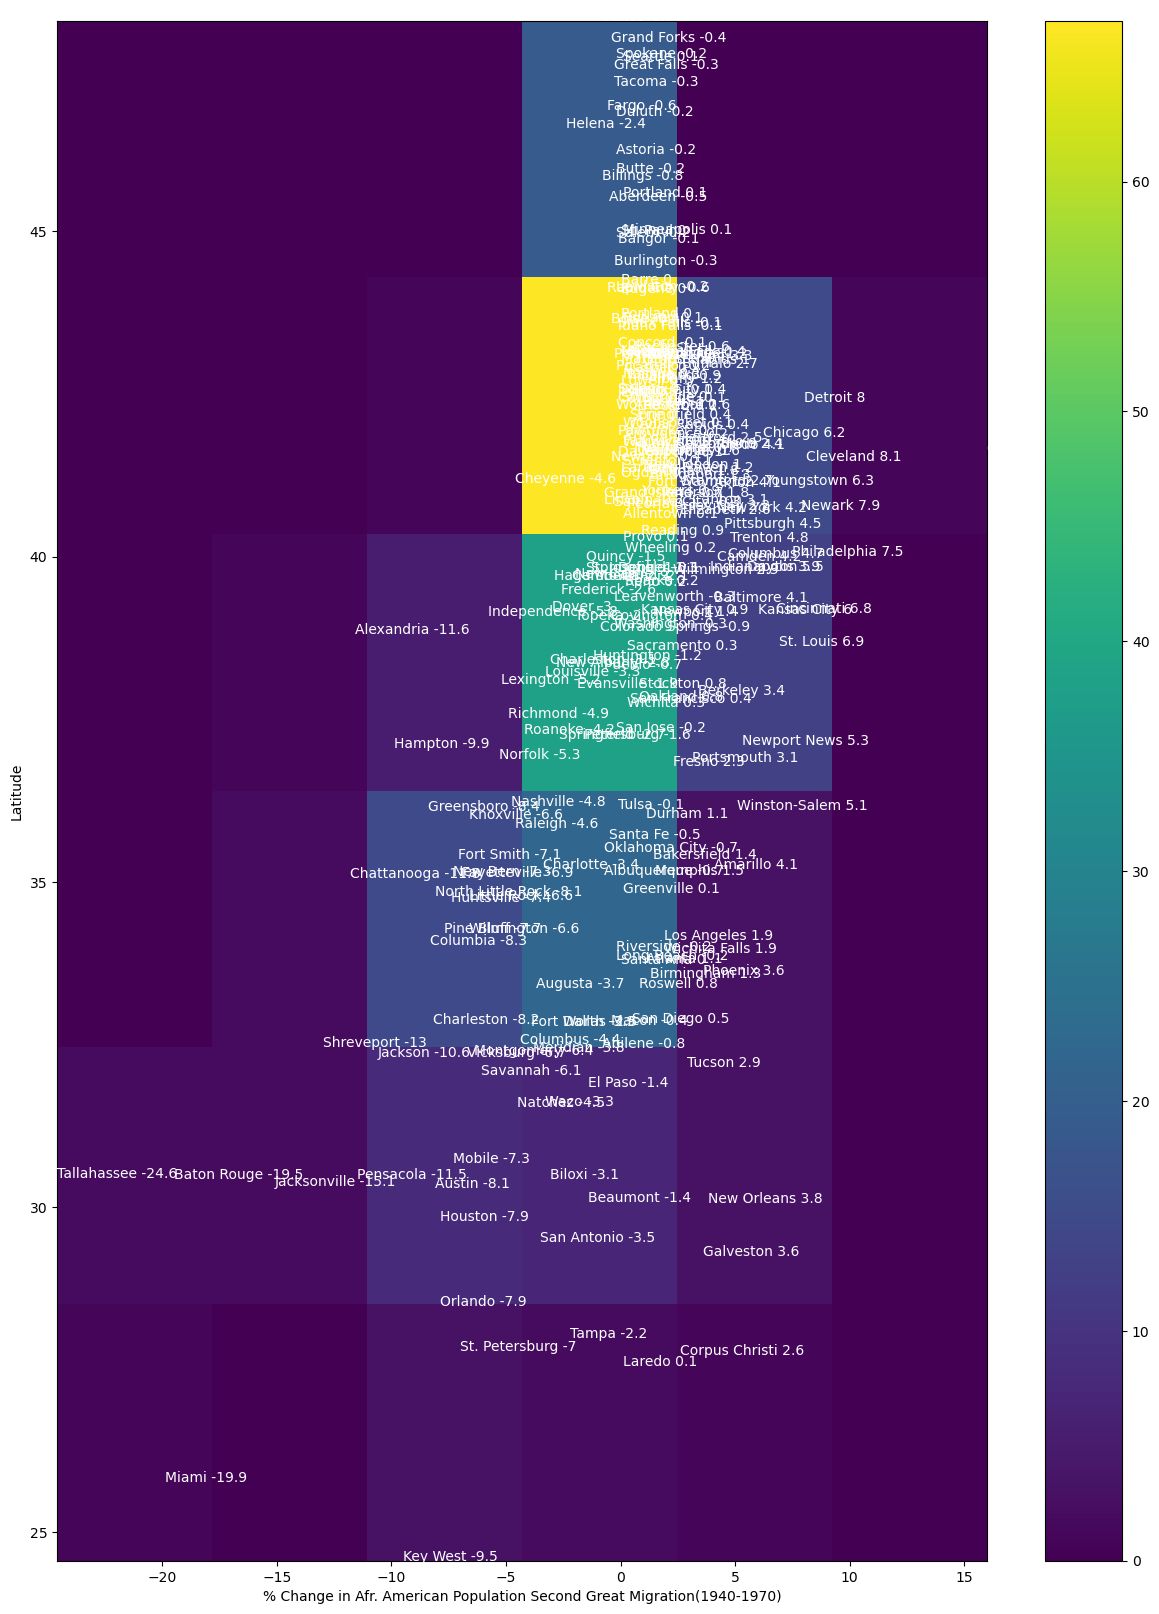
Show code cell source
import matplotlib.pyplot as plt
fig=plt.figure(figsize=(15, 20))
X=df["Mig2"].astype(float)
Y=df["lat"]
heat_map= plt.hist2d(X, Y, bins=6) #heat map is a 2dimensional histogram
plt.xlabel("% Change in Afr. American Population Second Great Migration(1940-1970)")
plt.ylabel("Latitude")
names=df.reset_index()
for i in names.index:   ##add the names of the cities and %change in Afr. American population
    plt.text(names.Mig2[i],names.lat[i],names.city[i]+' '+str(names.Mig2[i]),fontsize=10,color='white')
plt.colorbar()
fig.savefig("Migration2.png")
fig,ax=plt.subplots(figsize=(35, 40))
X=df["Mig2"].astype(float)
Y=df["lat"]
heat_map= plt.hist2d(X, Y, bins=6,alpha=.6) #heat map is a 2dimensional histogram
plt.xlabel("% Change in Afr. American Population Second Great Migration(1940-1970)",size=30)
plt.ylabel("Latitude",size=30)
plt.yticks(fontsize=30)
plt.xticks(fontsize=30)
plt.xlim(-20,20)
names=df.reset_index()
for i in names.index:   ##add the names of the cities and %change in Afr. American population
    if names.Mig2[i]<0 and any(names.loc[i,'city'] in x for x in ["Austin","Chicago","Detroit","Cleveland","Dallas","Denver","Grand Rapids","Houston","Huntsville","Indianapolis","Jacksonville","Louisville","Miami","Milwaukee","Minneapolis","Montgomery","Mobile","Nashville","New York","New Orleans","Newark","Omaha","Philadelphia","Pittsburgh","Providence","Raleigh","San Antonio","San Francisco","Seattle","St. Louis","Washington, DC",]):
        plt.text(names.Mig2[i],names.lat[i],"x"+names.city[i]+'  '+str(names.Mig2[i]),fontsize=30,color='red')
    else:
        if any(names.loc[i,'city'] in x for x in ["Chicago","Detroit","Cleveland","Dallas","Grand Rapids","Indianapolis","Louisville","Milwaukee","Minneapolis","Montgomery","Nashville","New York","Newark","Omaha","Philadelphia","Pittsburgh","Providence","Raleigh","San Francisco","Seattle","St. Louis","Washington, DC",]):
            plt.text(names.Mig2[i],names.lat[i],"x"+names.city[i]+'  '+str(names.Mig2[i]),fontsize=30,color='black')

cbar = plt.colorbar()
cbar.set_label('# of cities', rotation=270,size=50)
cbar.ax.tick_params(labelsize=25)
fig.savefig("Migration2Simplified.png")
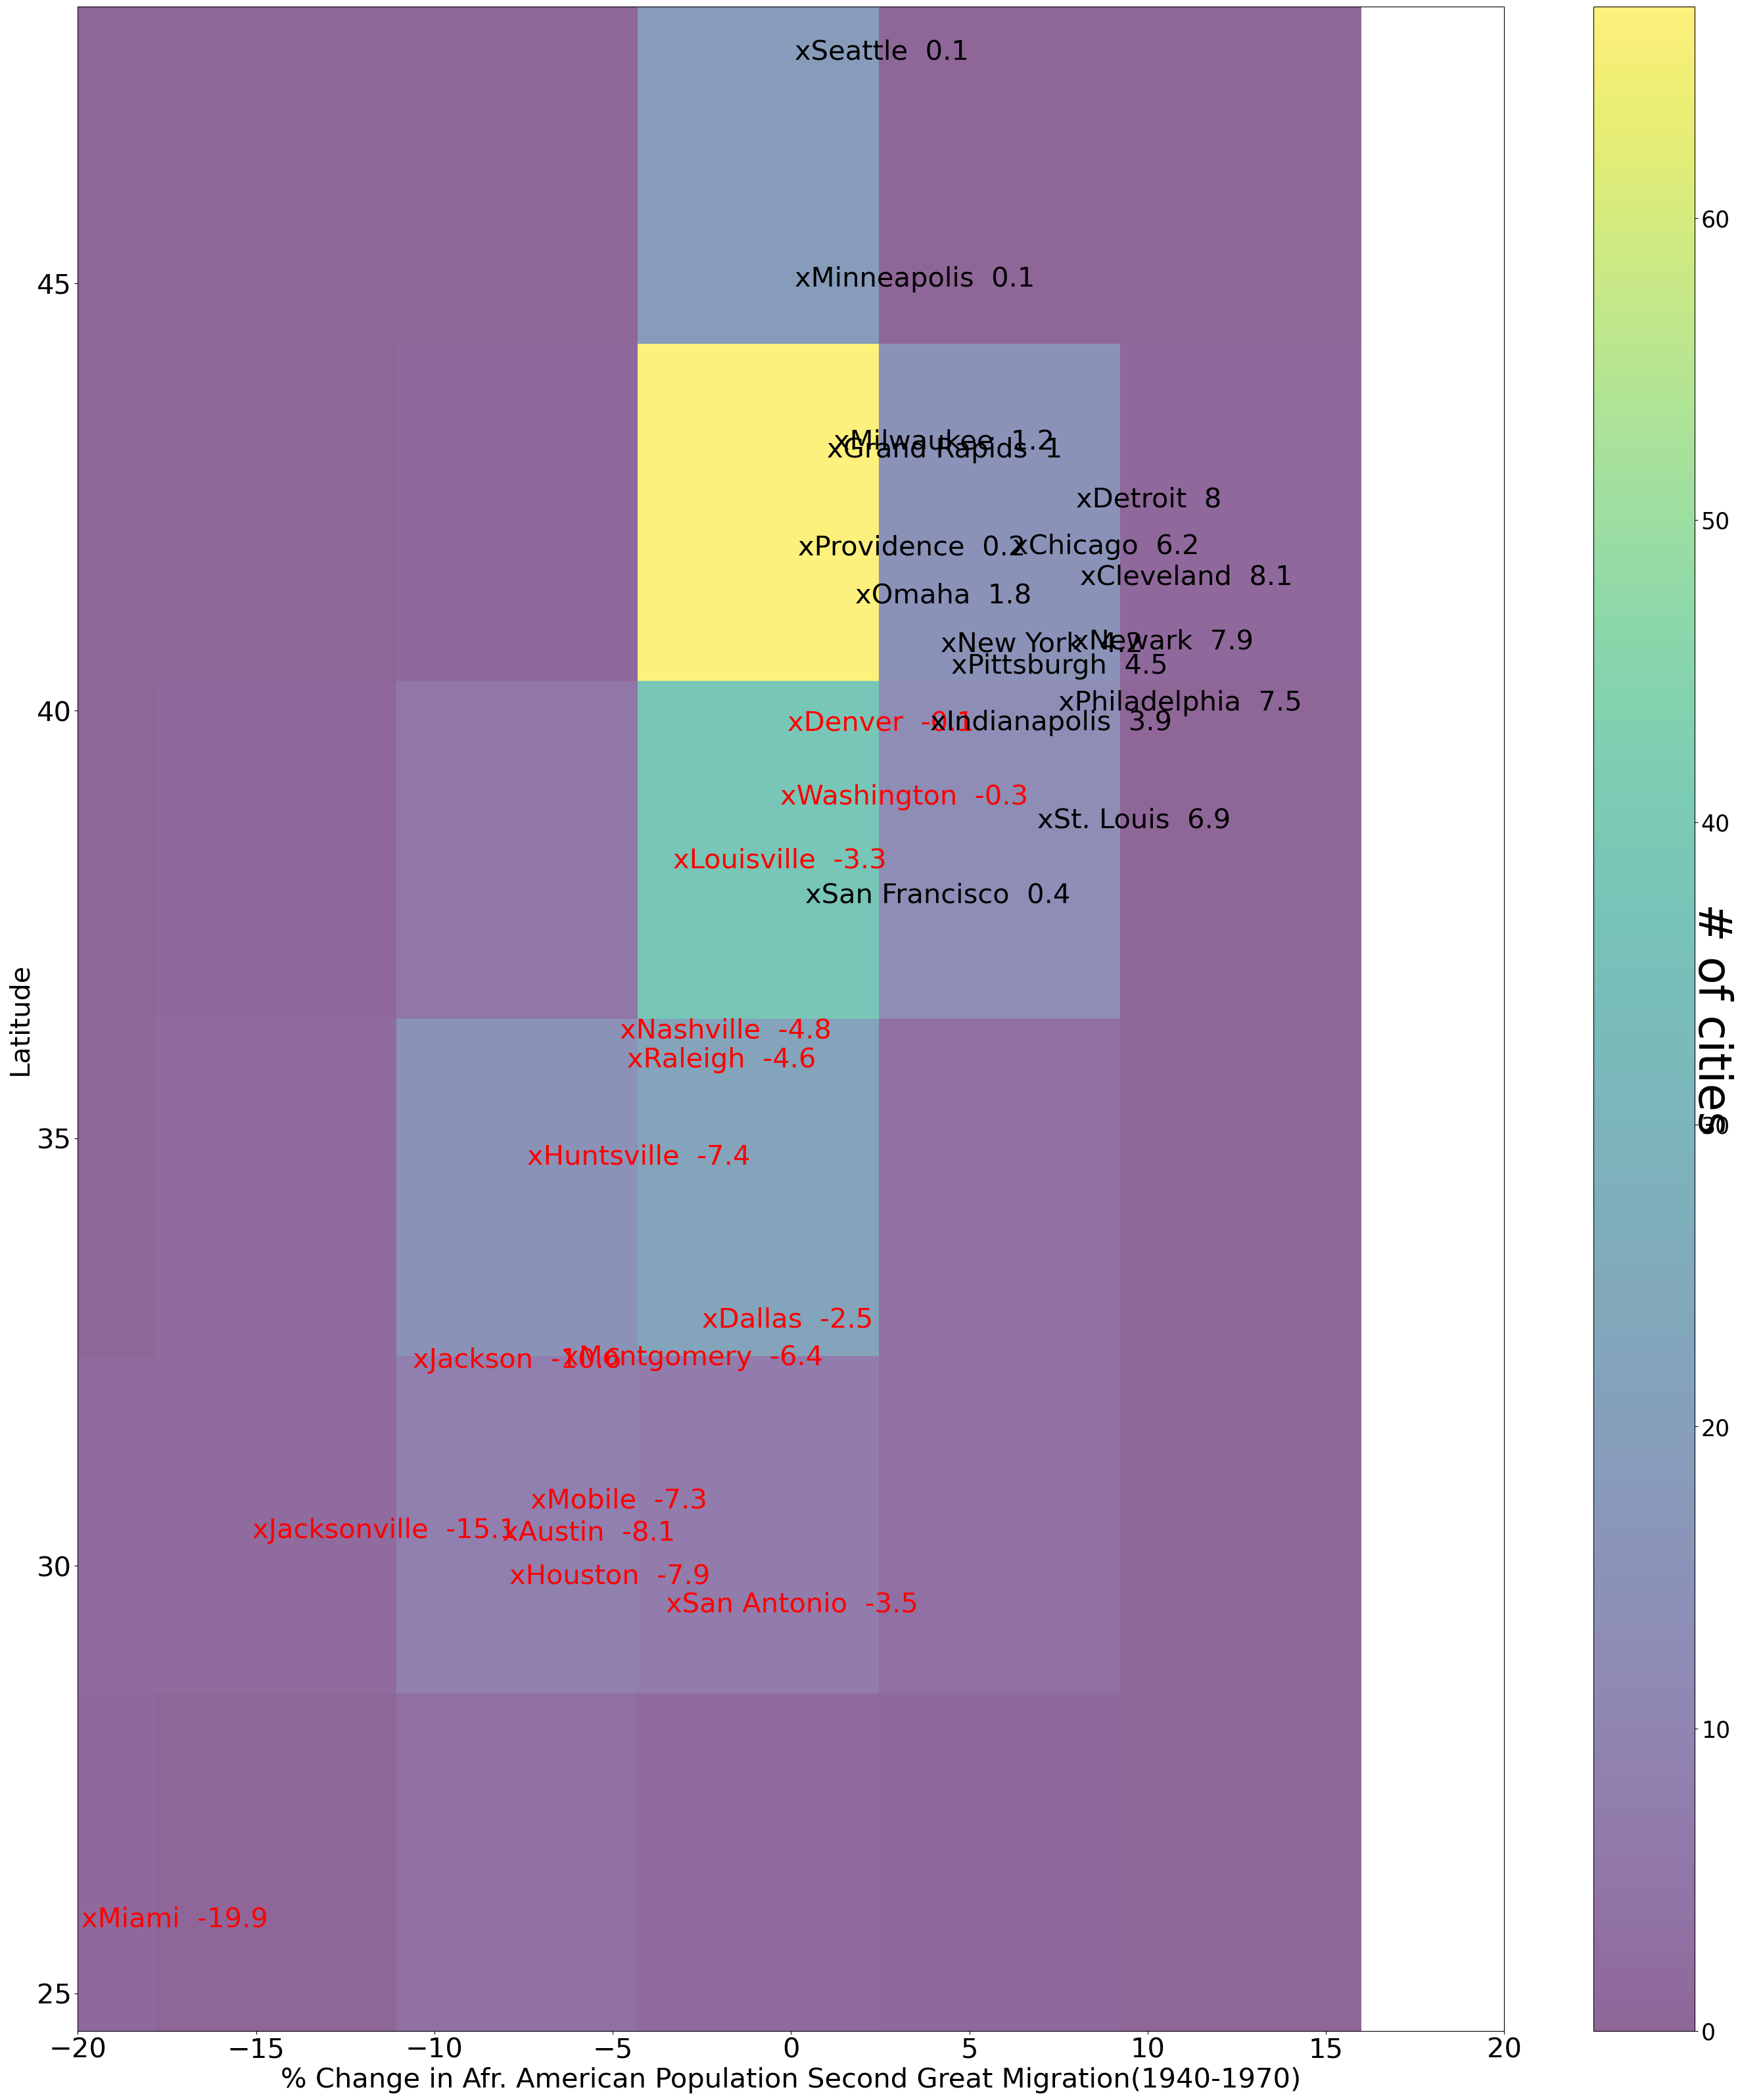
The percentage changes are smaller for the 2nd great migration when compared to the first. For example, Chicago dropped from 24.6 to 6.2.
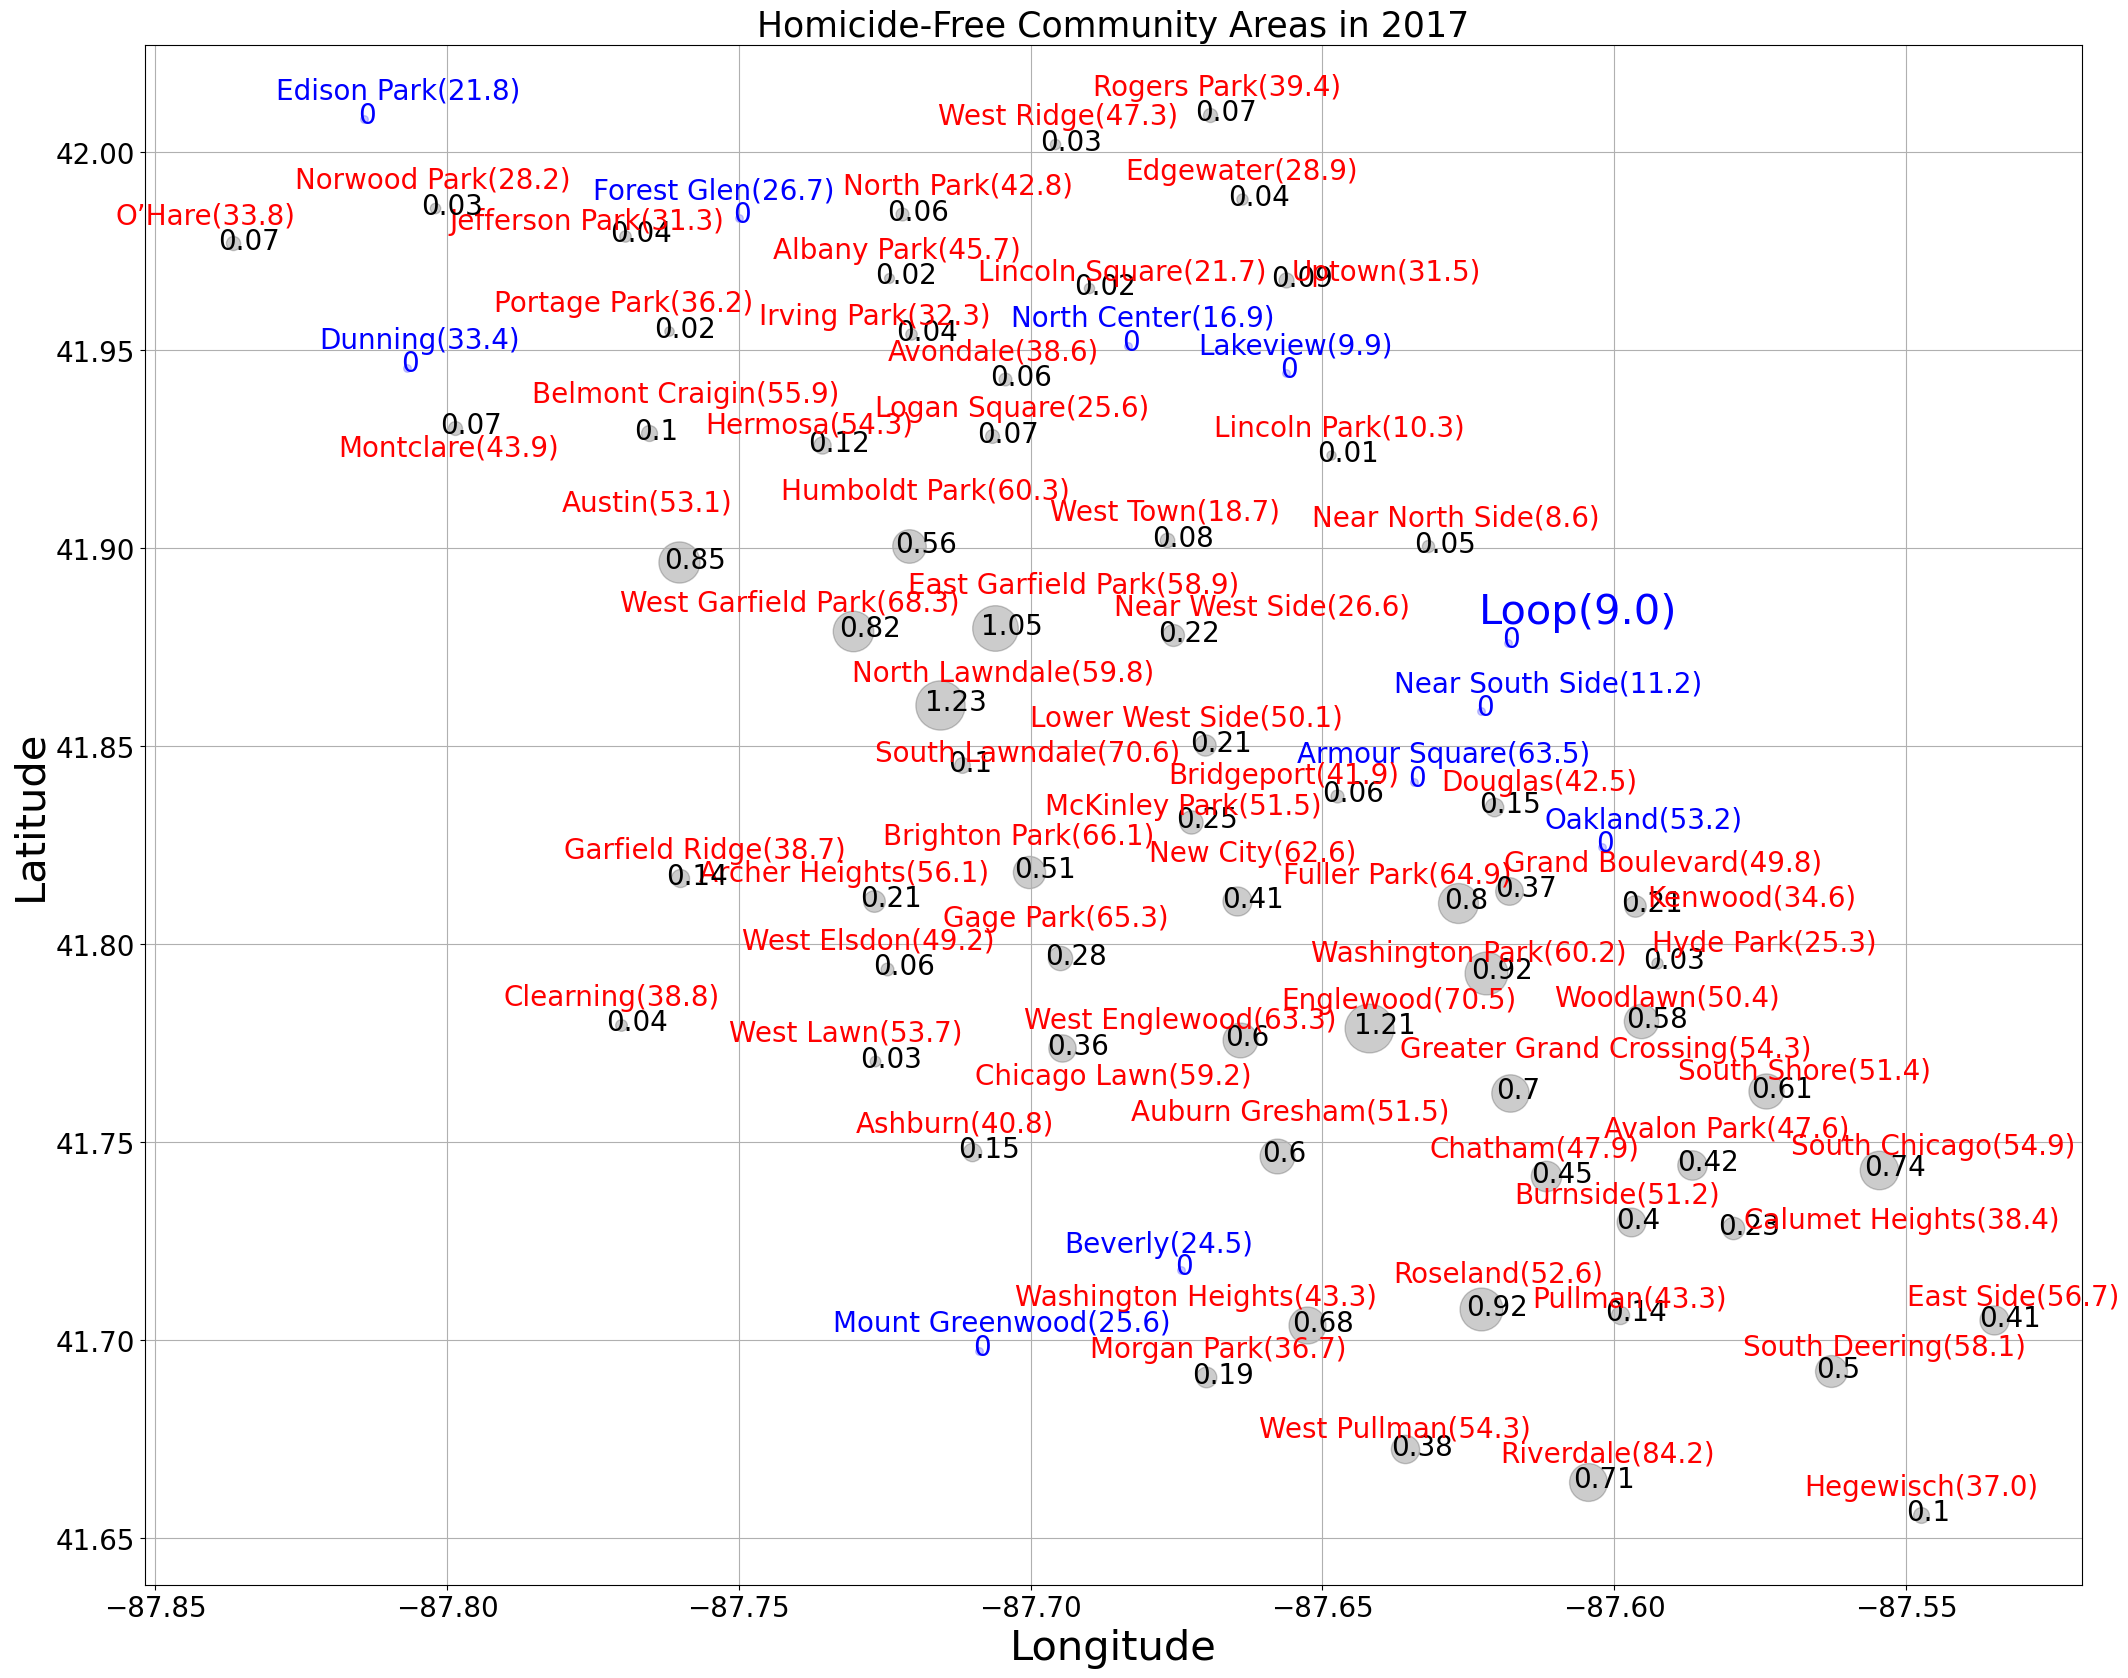
Chicago Hardship Index
import pandas as pd
raw_hardship=pd.read_excel('HIHOM20142017.xlsx')
dfHI14=raw_hardship[["Community","population(K)","HI14","UNEMP14","NOHS14","DEP14","HOUS14","POV14","INC14","HOM14","LAT","LON"]]
dfHI17=raw_hardship[["Community","population(K)","HI17","UNEMP17","NOHS17","DEP17","HOUS17","POV17","INC17","HOM17","LAT","LON"]]
hom_df = dfHI17
import matplotlib.pyplot as plt
fig=plt.figure(figsize=(25,20))

for i in hom_df.index:

    if hom_df.loc[i,"HOM17"]==0:
        plt.scatter(hom_df.loc[i,'LON'], hom_df.loc[i,'LAT'],s=30,color='b', alpha=0.2)
        plt.gca().text(hom_df.loc[i,'LON']-.001, hom_df.loc[i,'LAT']-.001,hom_df.loc[i,'HOM17'],color='b', alpha=1,size=20)
        if hom_df.loc[i,"Community"] in ["Loop"]:
            plt.gca().text(hom_df.loc[i,'LON']-.005, hom_df.loc[i,'LAT']+.005, hom_df.loc[i,'Community']+'('+str(hom_df.loc[i,'HI17'])+')',color='blue', size=30)
        elif hom_df.loc[i,"Community"] in ["Hyde Park","Near West Side","Kenwood","Near North Side","West Town"]:
            plt.gca().text(hom_df.loc[i,'LON']+.003, hom_df.loc[i,'LAT']-.005, hom_df.loc[i,'Community']+'('+str(hom_df.loc[i,'HI17'])+')',color='blue', size=20)
        elif hom_df.loc[i,"Community"] in ["Lincoln Park","Uptown","Edgewater","Rogers Park","Logan Square","Avondale"]:
            plt.gca().text(hom_df.loc[i,'LON']-.015, hom_df.loc[i,'LAT']-.0075, hom_df.loc[i,'Community']+'('+str(hom_df.loc[i,'HI17'])+')',color='blue', size=20)
        elif hom_df.loc[i,"Community"] in ["Lincoln Square","Irving Park","Portage Park","Jefferson Park"]:
            plt.gca().text(hom_df.loc[i,'LON']-.025, hom_df.loc[i,'LAT']-.0075, hom_df.loc[i,'Community']+'('+str(hom_df.loc[i,'HI17'])+')',color='blue', size=20)
        elif hom_df.loc[i,"Community"] in ["Dunning","O’Hare","Edison Park","Norwood Park"]:
            plt.gca().text(hom_df.loc[i,'LON']-.015, hom_df.loc[i,'LAT']+.005, hom_df.loc[i,'Community']+'('+str(hom_df.loc[i,'HI17'])+')',color='blue', size=20)

        elif hom_df.loc[i,"Community"] in ["Garfield Ridge","Clearning","Ashburn","Morgan Park"]:
            plt.gca().text(hom_df.loc[i,'LON']-.015, hom_df.loc[i,'LAT']+.0015, hom_df.loc[i,'Community']+'('+str(hom_df.loc[i,'HI17'])+')',color='blue', size=20)
        elif hom_df.loc[i,"Community"] in ["Hegewisch"]:
            plt.gca().text(hom_df.loc[i,'LON']-.01, hom_df.loc[i,'LAT']-.0075, hom_df.loc[i,'Community']+'('+str(hom_df.loc[i,'HI17'])+')',color='blue', size=20)
        elif hom_df.loc[i,"Community"] in ["Forest Glen"]:
            plt.gca().text(hom_df.loc[i,'LON']-.025, hom_df.loc[i,'LAT']+.005, hom_df.loc[i,'Community']+'('+str(hom_df.loc[i,'HI17'])+')',color='blue', size=20)
        elif hom_df.loc[i,"Community"] in ["North Center"]:
            plt.gca().text(hom_df.loc[i,'LON']-.02, hom_df.loc[i,'LAT']+.005, hom_df.loc[i,'Community']+'('+str(hom_df.loc[i,'HI17'])+')',color='blue', size=20)
        elif hom_df.loc[i,"Community"] in ["Oakland"]:
            plt.gca().text(hom_df.loc[i,'LON']-.01, hom_df.loc[i,'LAT']+.005, hom_df.loc[i,'Community']+'('+str(hom_df.loc[i,'HI17'])+')',color='blue', size=20)
        elif hom_df.loc[i,"Community"] in ["Mount Greenwood"]:
            plt.gca().text(hom_df.loc[i,'LON']-.025, hom_df.loc[i,'LAT']+.005, hom_df.loc[i,'Community']+'('+str(hom_df.loc[i,'HI17'])+')',color='blue', size=20)
        elif hom_df.loc[i,"Community"] in ["Lakeview"]:
            plt.gca().text(hom_df.loc[i,'LON']-.015, hom_df.loc[i,'LAT']+.005, hom_df.loc[i,'Community']+'('+str(hom_df.loc[i,'HI17'])+')',color='blue', size=20)
        elif hom_df.loc[i,"Community"] in ["Near South Side"]:
            plt.gca().text(hom_df.loc[i,'LON']-.015, hom_df.loc[i,'LAT']+.005, hom_df.loc[i,'Community']+'('+str(hom_df.loc[i,'HI17'])+')',color='blue', size=20)

        elif hom_df.loc[i,"Community"] in ["Edison Park"]:
            plt.gca().text(hom_df.loc[i,'LON']-.015, hom_df.loc[i,'LAT']+.005, hom_df.loc[i,'Community']+'('+str(hom_df.loc[i,'HI17'])+')',color='green', size=20)
        elif hom_df.loc[i,"Community"] in ["Beverly"]:
            plt.gca().text(hom_df.loc[i,'LON']-.02, hom_df.loc[i,'LAT']+.0045, hom_df.loc[i,'Community']+'('+str(hom_df.loc[i,'HI17'])+')',color='blue', size=20)


        else:
            plt.gca().text(hom_df.loc[i,'LON']-.02,hom_df.loc[i,'LAT']+.005,hom_df.loc[i,'Community']+'('+str(hom_df.loc[i,'HI17'])+')',color='blue', size=20)

    else:
        p=hom_df.loc[i,'population(K)']
        plt.scatter(hom_df.loc[i,'LON'], hom_df.loc[i,'LAT'],s=30+1000*hom_df.loc[i,'HOM17']/p,color='k', alpha=0.2)
        plt.gca().text(hom_df.loc[i,'LON']-.0025, hom_df.loc[i,'LAT']-.0015,str(round(hom_df.loc[i,'HOM17']/p,2)),color='k', alpha=1,size=20)
        if hom_df.loc[i,"Community"] in ["Austin"]:
            plt.gca().text(hom_df.loc[i,'LON']-.02,hom_df.loc[i,'LAT']+.013, hom_df.loc[i,'Community']+'('+str(hom_df.loc[i,'HI17'])+')',color='red', size=20)
        elif hom_df.loc[i,"Community"] in ["Belmont Craigin"]:
            plt.gca().text(hom_df.loc[i,'LON']-.02,hom_df.loc[i,'LAT']+.0078, hom_df.loc[i,'Community']+'('+str(hom_df.loc[i,'HI17'])+')',color='red', size=20)
        elif hom_df.loc[i,"Community"] in ["Chicago Lawn"]:
            plt.gca().text(hom_df.loc[i,'LON']-.015,hom_df.loc[i,'LAT']-.009, hom_df.loc[i,'Community']+'('+str(hom_df.loc[i,'HI17'])+')',color='red', size=20)
        elif hom_df.loc[i,"Community"] in ["Pullman"]:
            plt.gca().text(hom_df.loc[i,'LON']-.015,hom_df.loc[i,'LAT']+.002,hom_df.loc[i,'Community']+'('+str(hom_df.loc[i,'HI17'])+')',color='red', size=20)
        elif hom_df.loc[i,"Community"] in ["Roseland"]:
            plt.gca().text(hom_df.loc[i,'LON']-.015,hom_df.loc[i,'LAT']+.007,hom_df.loc[i,'Community']+'('+str(hom_df.loc[i,'HI17'])+')',color='red', size=20)
        elif hom_df.loc[i,"Community"] in ["West Garfield Park"]:
            plt.gca().text(hom_df.loc[i,'LON']-.04,hom_df.loc[i,'LAT']+.005,hom_df.loc[i,'Community']+'('+str(hom_df.loc[i,'HI17'])+')',color='red', size=20)
        elif hom_df.loc[i,"Community"] in ["Oakland","Armour Square"]:
            plt.gca().text(hom_df.loc[i,'LON']-.001,hom_df.loc[i,'LAT']+.002,hom_df.loc[i,'Community']+'('+str(hom_df.loc[i,'HI17'])+')',color='red', size=20)
        elif hom_df.loc[i,"Community"] in ["Bridgeport"]:
            plt.gca().text(hom_df.loc[i,'LON']-.029,hom_df.loc[i,'LAT']+.003,hom_df.loc[i,'Community']+'('+str(hom_df.loc[i,'HI17'])+')',color='red', size=20)
        elif hom_df.loc[i,"Community"] in ["South Shore"]:
            plt.gca().text(hom_df.loc[i,'LON']-.015,hom_df.loc[i,'LAT']+.003,hom_df.loc[i,'Community']+'('+str(hom_df.loc[i,'HI17'])+')',color='red', size=20)
        elif hom_df.loc[i,"Community"] in ["West Pullman"]:
            plt.gca().text(hom_df.loc[i,'LON']-.025,hom_df.loc[i,'LAT']+.003,hom_df.loc[i,'Community']+'('+str(hom_df.loc[i,'HI17'])+')',color='red', size=20)
        elif hom_df.loc[i,"Community"] in ["Washington Park"]:
            plt.gca().text(hom_df.loc[i,'LON']-.03,hom_df.loc[i,'LAT']+.003,hom_df.loc[i,'Community']+'('+str(hom_df.loc[i,'HI17'])+')',color='red', size=20)

        elif hom_df.loc[i,"Community"] in ["Washington Heights"]:
            plt.gca().text(hom_df.loc[i,'LON']-.05,hom_df.loc[i,'LAT']+.005,hom_df.loc[i,'Community']+'('+str(hom_df.loc[i,'HI17'])+')',color='red', size=20)
        elif hom_df.loc[i,"Community"] in ["West Ridge","Albany Park"]:
            plt.gca().text(hom_df.loc[i,'LON']-.02,hom_df.loc[i,'LAT']+.005,hom_df.loc[i,'Community']+'('+str(hom_df.loc[i,'HI17'])+')',color='red', size=20)
        elif hom_df.loc[i,"Community"] in ["North Park"]:
            plt.gca().text(hom_df.loc[i,'LON']-.01,hom_df.loc[i,'LAT']+.005,hom_df.loc[i,'Community']+'('+str(hom_df.loc[i,'HI17'])+')',color='red', size=20)
        elif hom_df.loc[i,"Community"] in ["Lincoln Square"]:
            plt.gca().text(hom_df.loc[i,'LON']-.019,hom_df.loc[i,'LAT']+.002,hom_df.loc[i,'Community']+'('+str(hom_df.loc[i,'HI17'])+')',color='red', size=20)
        elif hom_df.loc[i,"Community"] in ["Hermosa"]:
            plt.gca().text(hom_df.loc[i,'LON']-.02,hom_df.loc[i,'LAT']+.003,hom_df.loc[i,'Community']+'('+str(hom_df.loc[i,'HI17'])+')',color='red', size=20)
        elif hom_df.loc[i,"Community"] in ["Montclare"]:
            plt.gca().text(hom_df.loc[i,'LON']-.02,hom_df.loc[i,'LAT']-.007, hom_df.loc[i,'Community']+'('+str(hom_df.loc[i,'HI17'])+')',color='red', size=20)
        elif hom_df.loc[i,"Community"] in ["West Town"]:
            plt.gca().text(hom_df.loc[i,'LON']-.02,hom_df.loc[i,'LAT']+.005, hom_df.loc[i,'Community']+'('+str(hom_df.loc[i,'HI17'])+')',color='red', size=20)
        elif hom_df.loc[i,"Community"] in ["Near West Side"]:
            plt.gca().text(hom_df.loc[i,'LON']-.01,hom_df.loc[i,'LAT']+.005, hom_df.loc[i,'Community']+'('+str(hom_df.loc[i,'HI17'])+')',color='red', size=20)
        elif hom_df.loc[i,"Community"] in ["Lower West Side"]:
            plt.gca().text(hom_df.loc[i,'LON']-.03,hom_df.loc[i,'LAT']+.005,hom_df.loc[i,'Community']+'('+str(hom_df.loc[i,'HI17'])+')',color='red', size=20)
        elif hom_df.loc[i,"Community"] in ["North Lawndale"]:
            plt.gca().text(hom_df.loc[i,'LON']-.015,hom_df.loc[i,'LAT']+.006,hom_df.loc[i,'Community']+'('+str(hom_df.loc[i,'HI17'])+')',color='red', size=20)
        elif hom_df.loc[i,"Community"] in ["Douglas"]:
            plt.gca().text(hom_df.loc[i,'LON']-.009,hom_df.loc[i,'LAT']+.004,hom_df.loc[i,'Community']+'('+str(hom_df.loc[i,'HI17'])+')',color='red', size=20)
        elif hom_df.loc[i,"Community"] in ["Archer Heights"]:
            plt.gca().text(hom_df.loc[i,'LON']-.03,hom_df.loc[i,'LAT']+.005, hom_df.loc[i,'Community']+'('+str(hom_df.loc[i,'HI17'])+')',color='red', size=20)
        elif hom_df.loc[i,"Community"] in ["New City"]:
            plt.gca().text(hom_df.loc[i,'LON']-.015,hom_df.loc[i,'LAT']+.01, hom_df.loc[i,'Community']+'('+str(hom_df.loc[i,'HI17'])+')',color='red', size=20)
        elif hom_df.loc[i,"Community"] in ["South Chicago"]:
            plt.gca().text(hom_df.loc[i,'LON']-.015,hom_df.loc[i,'LAT']+.004, hom_df.loc[i,'Community']+'('+str(hom_df.loc[i,'HI17'])+')',color='red', size=20)
        elif hom_df.loc[i,"Community"] in ["West Lawn"]:
            plt.gca().text(hom_df.loc[i,'LON']-.025,hom_df.loc[i,'LAT']+.005, hom_df.loc[i,'Community']+'('+str(hom_df.loc[i,'HI17'])+')',color='red', size=20)
        elif hom_df.loc[i,"Community"] in ["Kenwood"]:
            plt.gca().text(hom_df.loc[i,'LON']+.002,hom_df.loc[i,'LAT'], hom_df.loc[i,'Community']+'('+str(hom_df.loc[i,'HI17'])+')',color='red', size=20)
        elif hom_df.loc[i,"Community"] in ["Grand Boulevard"]:
            plt.gca().text(hom_df.loc[i,'LON']-.001,hom_df.loc[i,'LAT']+.005,hom_df.loc[i,'Community']+'('+str(hom_df.loc[i,'HI17'])+')',color='red', size=20)
        elif hom_df.loc[i,"Community"] in ["Fuller Park"]:
            plt.gca().text(hom_df.loc[i,'LON']-.03,hom_df.loc[i,'LAT']+.005,hom_df.loc[i,'Community']+'('+str(hom_df.loc[i,'HI17'])+')',color='red', size=20)
        elif hom_df.loc[i,"Community"] in ["Hyde Park"]:
            plt.gca().text(hom_df.loc[i,'LON']-.001,hom_df.loc[i,'LAT']+.003,hom_df.loc[i,'Community']+'('+str(hom_df.loc[i,'HI17'])+')',color='red', size=20)
        elif hom_df.loc[i,"Community"] in ["Calumet Heights"]:
            plt.gca().text(hom_df.loc[i,'LON']+.002,hom_df.loc[i,'LAT'],hom_df.loc[i,'Community']+'('+str(hom_df.loc[i,'HI17'])+')',color='red', size=20)
        elif hom_df.loc[i,"Community"] in ["Jefferson Park"]:
            plt.gca().text(hom_df.loc[i,'LON']-.03,hom_df.loc[i,'LAT']+.0015,hom_df.loc[i,'Community']+'('+str(hom_df.loc[i,'HI17'])+')',color='red', size=20)
        elif hom_df.loc[i,"Community"] in ["Uptown"]:
            plt.gca().text(hom_df.loc[i,'LON']+.001,hom_df.loc[i,'LAT'],hom_df.loc[i,'Community']+'('+str(hom_df.loc[i,'HI17'])+')',color='red', size=20)
        elif hom_df.loc[i,"Community"] in ["West Englewood"]:
            plt.gca().text(hom_df.loc[i,'LON']-.037,hom_df.loc[i,'LAT']+.003,hom_df.loc[i,'Community']+'('+str(hom_df.loc[i,'HI17'])+')',color='red', size=20)
        elif hom_df.loc[i,"Community"] in ["Portage Park"]:
            plt.gca().text(hom_df.loc[i,'LON']-.03,hom_df.loc[i,'LAT']+.005,hom_df.loc[i,'Community']+'('+str(hom_df.loc[i,'HI17'])+')',color='red', size=20)
        elif hom_df.loc[i,"Community"] in ["Irving Park"]:
            plt.gca().text(hom_df.loc[i,'LON']-.026, hom_df.loc[i,'LAT']+.0025, hom_df.loc[i,'Community']+'('+str(hom_df.loc[i,'HI17'])+')',color='red', size=20)
        elif hom_df.loc[i,"Community"] in ["Humboldt Park"]:
            plt.gca().text(hom_df.loc[i,'LON']-.022,hom_df.loc[i,'LAT']+.012,hom_df.loc[i,'Community']+'('+str(hom_df.loc[i,'HI17'])+')',color='red', size=20)
        elif hom_df.loc[i,"Community"] in ["Brighton Park"]:
            plt.gca().text(hom_df.loc[i,'LON']-.025,hom_df.loc[i,'LAT']+.007, hom_df.loc[i,'Community']+'('+str(hom_df.loc[i,'HI17'])+')',color='red', size=20)
        elif hom_df.loc[i,"Community"] in ["South Lawndale"]:
            plt.gca().text(hom_df.loc[i,'LON']-.015,hom_df.loc[i,'LAT']+.001, hom_df.loc[i,'Community']+'('+str(hom_df.loc[i,'HI17'])+')',color='red', size=20)
        elif hom_df.loc[i,"Community"] in ["McKinley Park"]:
            plt.gca().text(hom_df.loc[i,'LON']-.025,hom_df.loc[i,'LAT']+.002, hom_df.loc[i,'Community']+'('+str(hom_df.loc[i,'HI17'])+')',color='red', size=20)
        elif hom_df.loc[i,"Community"] in ["West Elsdon"]:
            plt.gca().text(hom_df.loc[i,'LON']-.025,hom_df.loc[i,'LAT']+.005, hom_df.loc[i,'Community']+'('+str(hom_df.loc[i,'HI17'])+')',color='red', size=20)
        elif hom_df.loc[i,"Community"] in ["Gage Park"]:
            plt.gca().text(hom_df.loc[i,'LON']-.02,hom_df.loc[i,'LAT']+.008, hom_df.loc[i,'Community']+'('+str(hom_df.loc[i,'HI17'])+')',color='red', size=20)
        elif hom_df.loc[i,"Community"] in ["Woodlawn"]:
            plt.gca().text(hom_df.loc[i,'LON']-.015,hom_df.loc[i,'LAT']+.004, hom_df.loc[i,'Community']+'('+str(hom_df.loc[i,'HI17'])+')',color='red', size=20)
        elif hom_df.loc[i,"Community"] in ["Englewood"]:
            plt.gca().text(hom_df.loc[i,'LON']-.015,hom_df.loc[i,'LAT']+.005, hom_df.loc[i,'Community']+'('+str(hom_df.loc[i,'HI17'])+')',color='red', size=20)
        elif hom_df.loc[i,"Community"] in ["Greater Grand Crossing"]:
            plt.gca().text(hom_df.loc[i,'LON']-.019,hom_df.loc[i,'LAT']+.009, hom_df.loc[i,'Community']+'('+str(hom_df.loc[i,'HI17'])+')',color='red', size=20)
        elif hom_df.loc[i,"Community"] in ["Auburn Gresham"]:
            plt.gca().text(hom_df.loc[i,'LON']-.025,hom_df.loc[i,'LAT']+.009, hom_df.loc[i,'Community']+'('+str(hom_df.loc[i,'HI17'])+')',color='red', size=20)
        elif hom_df.loc[i,"Community"] in ["Avalon Park"]:
            plt.gca().text(hom_df.loc[i,'LON']-.015,hom_df.loc[i,'LAT']+.007,hom_df.loc[i,'Community']+'('+str(hom_df.loc[i,'HI17'])+')',color='red', size=20)
        elif hom_df.loc[i,"Community"] in ["Burnside"]:
            plt.gca().text(hom_df.loc[i,'LON']-.02,hom_df.loc[i,'LAT']+.005,hom_df.loc[i,'Community']+'('+str(hom_df.loc[i,'HI17'])+')',color='red', size=20)
        elif hom_df.loc[i,"Community"] in ["East Side","South Deering"]:
            plt.gca().text(hom_df.loc[i,'LON']-.015,hom_df.loc[i,'LAT']+.004, hom_df.loc[i,'Community']+'('+str(hom_df.loc[i,'HI17'])+')',color='red', size=20)
        elif hom_df.loc[i,"Community"] in ["Riverdale"]:
            plt.gca().text(hom_df.loc[i,'LON']-.015,hom_df.loc[i,'LAT']+.005, hom_df.loc[i,'Community']+'('+str(hom_df.loc[i,'HI17'])+')',color='red', size=20)
        elif hom_df.loc[i,"Community"] in ["Norwood Park"]:
            plt.gca().text(hom_df.loc[i,'LON']-.024,hom_df.loc[i,'LAT']+.005, hom_df.loc[i,'Community']+'('+str(hom_df.loc[i,'HI17'])+')',color='red', size=20)
        elif hom_df.loc[i,"Community"] in ["East Garfield Park"]:
            plt.gca().text(hom_df.loc[i,'LON']-.015,hom_df.loc[i,'LAT']+.009,hom_df.loc[i,'Community']+'('+str(hom_df.loc[i,'HI17'])+')',color='red', size=20)

        else:
            plt.gca().text(hom_df.loc[i,'LON']-.02,hom_df.loc[i,'LAT']+.005,hom_df.loc[i,'Community']+'('+str(hom_df.loc[i,'HI17'])+')',color='red', size=20)

#plt.gca().set_facecolor('lightgray')
plt.gca().grid()
plt.yticks(fontsize=20)
plt.xticks(fontsize=20)
#title
plt.title('Homicide-Free Community Areas in 2017',size=25)
plt.xlabel("Longitude",size=30)
plt.ylabel("Latitude",size=30)
fig.savefig("Fig5revised.png")
#show the plot
plt.show()
2.6.3. Arts in STEM(STEAM)#
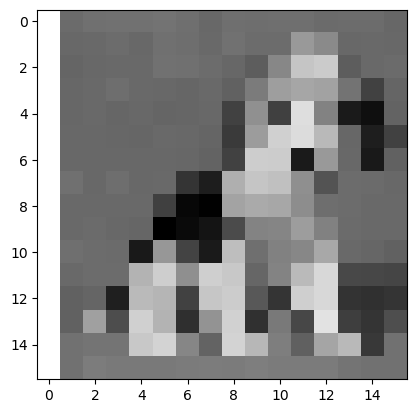
Pixel Images
1a) By increasing the number of pixels, we can get a better reproduction of the original. Create a 16x16 pixel image.
makepixelimage("images", 16)
<matplotlib.image.AxesImage at 0x1c256419dd0>
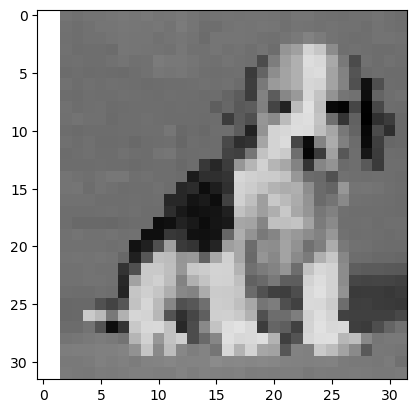
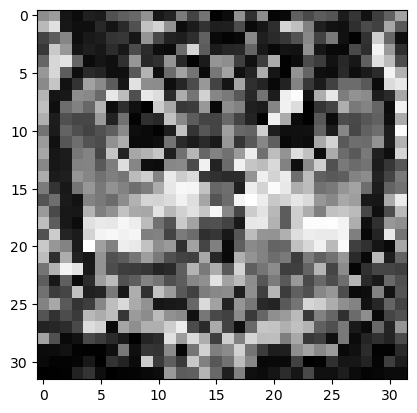
1b) Create a 32x32 pixel image.
makepixelimage("images", 32)
<matplotlib.image.AxesImage at 0x1c256d7f8d0>
Upload a different image into a folder called “my_images”. Then use the makepixelimage( , ) function to create an 8x8, 16x16 and 32x32 pixel image and see if the others in the class can guess your original image
Many answers possible.
makepixelimage("my_images", 8)
<matplotlib.image.AxesImage at 0x1c256e078d0>
makepixelimage("my_images", 16)
<matplotlib.image.AxesImage at 0x1c2562c4550>
makepixelimage("my_images", 32)
<matplotlib.image.AxesImage at 0x1c257efa5d0>
WORD CLOUDS Many Possible Answers
with open('john.txt','r') as file:  #read in the text file
    gospeljohn = file.readlines()
Word Cloud of Gospel of John with 30 words
Show code cell source
myimagejohn = calculate_frequencies(gospeljohn)
plt.imshow(myimagejohn, interpolation = 'nearest')
plt.axis('off')
plt.savefig('john.png', bbox_inches='tight')
plt.show()

Name that Tune! many possible answers
saintsaens = [so, so , so, so, la, la,la,la,so, so , do1, do1, so, so,fa,fa,mi,mi,fa,so,la,la,fa,fa,re,re,re,re,so,so,so,so]
play(saintsaens)
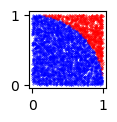
Random Numbers and Pi
Show code cell source
import matplotlib.pyplot as plt
import numpy as np
np.random.seed(1232023)
def dist(x,y):
    d=np.sqrt(x**2+y**2)
    return d
fig=plt.figure(figsize=(1,1))
N=5000
blue=0
red=0
for n in np.arange(0,N,1):
    x=np.random.rand(1)
    y=np.random.rand(1)
    if dist(x,y)<=1:
        plt.scatter(x, y,s=.1,  marker='o', color='blue')
        blue=blue+1
    else:
        plt.scatter(x, y,s=.1,  marker='o', color='red')
        red=red+1
print("Percentage of Blue Points=", (blue/N)*100)
print("Estimate of Pi=", 4* (blue/N))
Percentage of Blue Points= 78.24
Estimate of Pi= 3.1296
Simulating Formula 1#
Show code cell source
# frame 0
c1=car(.43,.15,'car1.png',.14,0)
c2=car(.2,.15,'car2.png',.12,0)
simulate(c1,c2,0)
#frame 1
c1.speed=.8
c1.go(.2,0)
c2.speed=.8
c2.go(.2,0)
simulate(c1,c2,1)
#frame 2
c1.speed=.9
c1.size=c1.size*.9
c1.go(.2,.15)
c1.image="car1left.png"
c2.speed=.9
c2.size=c2.size*.9
c2.go(.35,.15)
c2.image="car2left.png"
simulate(c1,c2,2)
frames=3
from PIL import Image
images = []
for n in range(frames):
    exec('a'+str(n)+'=Image.open("'+str(n)+'.png")')
    images.append(eval('a'+str(n)))
images[0].save('F1a.gif',
               save_all=True,
               append_images=images[1:],
               duration=300,
               loop=0)