import pandas as pd
import numpy as np
import matplotlib.pyplot as plt
4.3. Solution to Exercises#
4.3.1. Great Migration#
DATASETS: migration.xlsx; uscities.xlsx
We’ll use pandas to import the datafile migration.xlsx into a dataframe called migration.
migration=pd.read_excel('migration.xlsx')
migdf=migration #make a copy of the original dataframe
migdf.columns=["City","Mig2","Mig1"] #rename the columns
migdf["city"]="city"  #create a column for the city
migdf["state"]="state"  #create a column for the state
for m in migdf.index:
    x=migdf.loc[m,"City"].split(", ")  #split the city from the state
    migdf.loc[m,"city"]=x[0]  #add the city to the city column
    migdf.loc[m,"state"]=x[1]  #add the state to the state column
migdf.drop(['City'], axis=1, inplace=True) #Drop the original City column
migdf=migdf.set_index(["city","state"],drop=True) #create multi-index
rawlatlon=pd.read_excel("uscities.xlsx") #read data
latlon=rawlatlon[["city_ascii","lat","lng","state_id"]] #select columns
latlon.columns=["city","lat","lon","state"] #rename columns
latlon=latlon.set_index(["city","state"],drop=True) #create multi-index
df=pd.merge(latlon,migdf, how='inner', left_index=True,right_index=True)
df.columns=["lat","lon","Mig2","Mig1"]
df=df[df["Mig1"]!="No data"]
df=df[df["Mig2"]!="No data"]
df.head(2)
| lat | lon | Mig2 | Mig1 | ||
|---|---|---|---|---|---|
| city | state | ||||
| Seattle | WA | 47.6211 | -122.3244 | 0.1 | 6.1 |
| Spokane | WA | 47.6671 | -117.4330 | -0.2 | 0.7 |
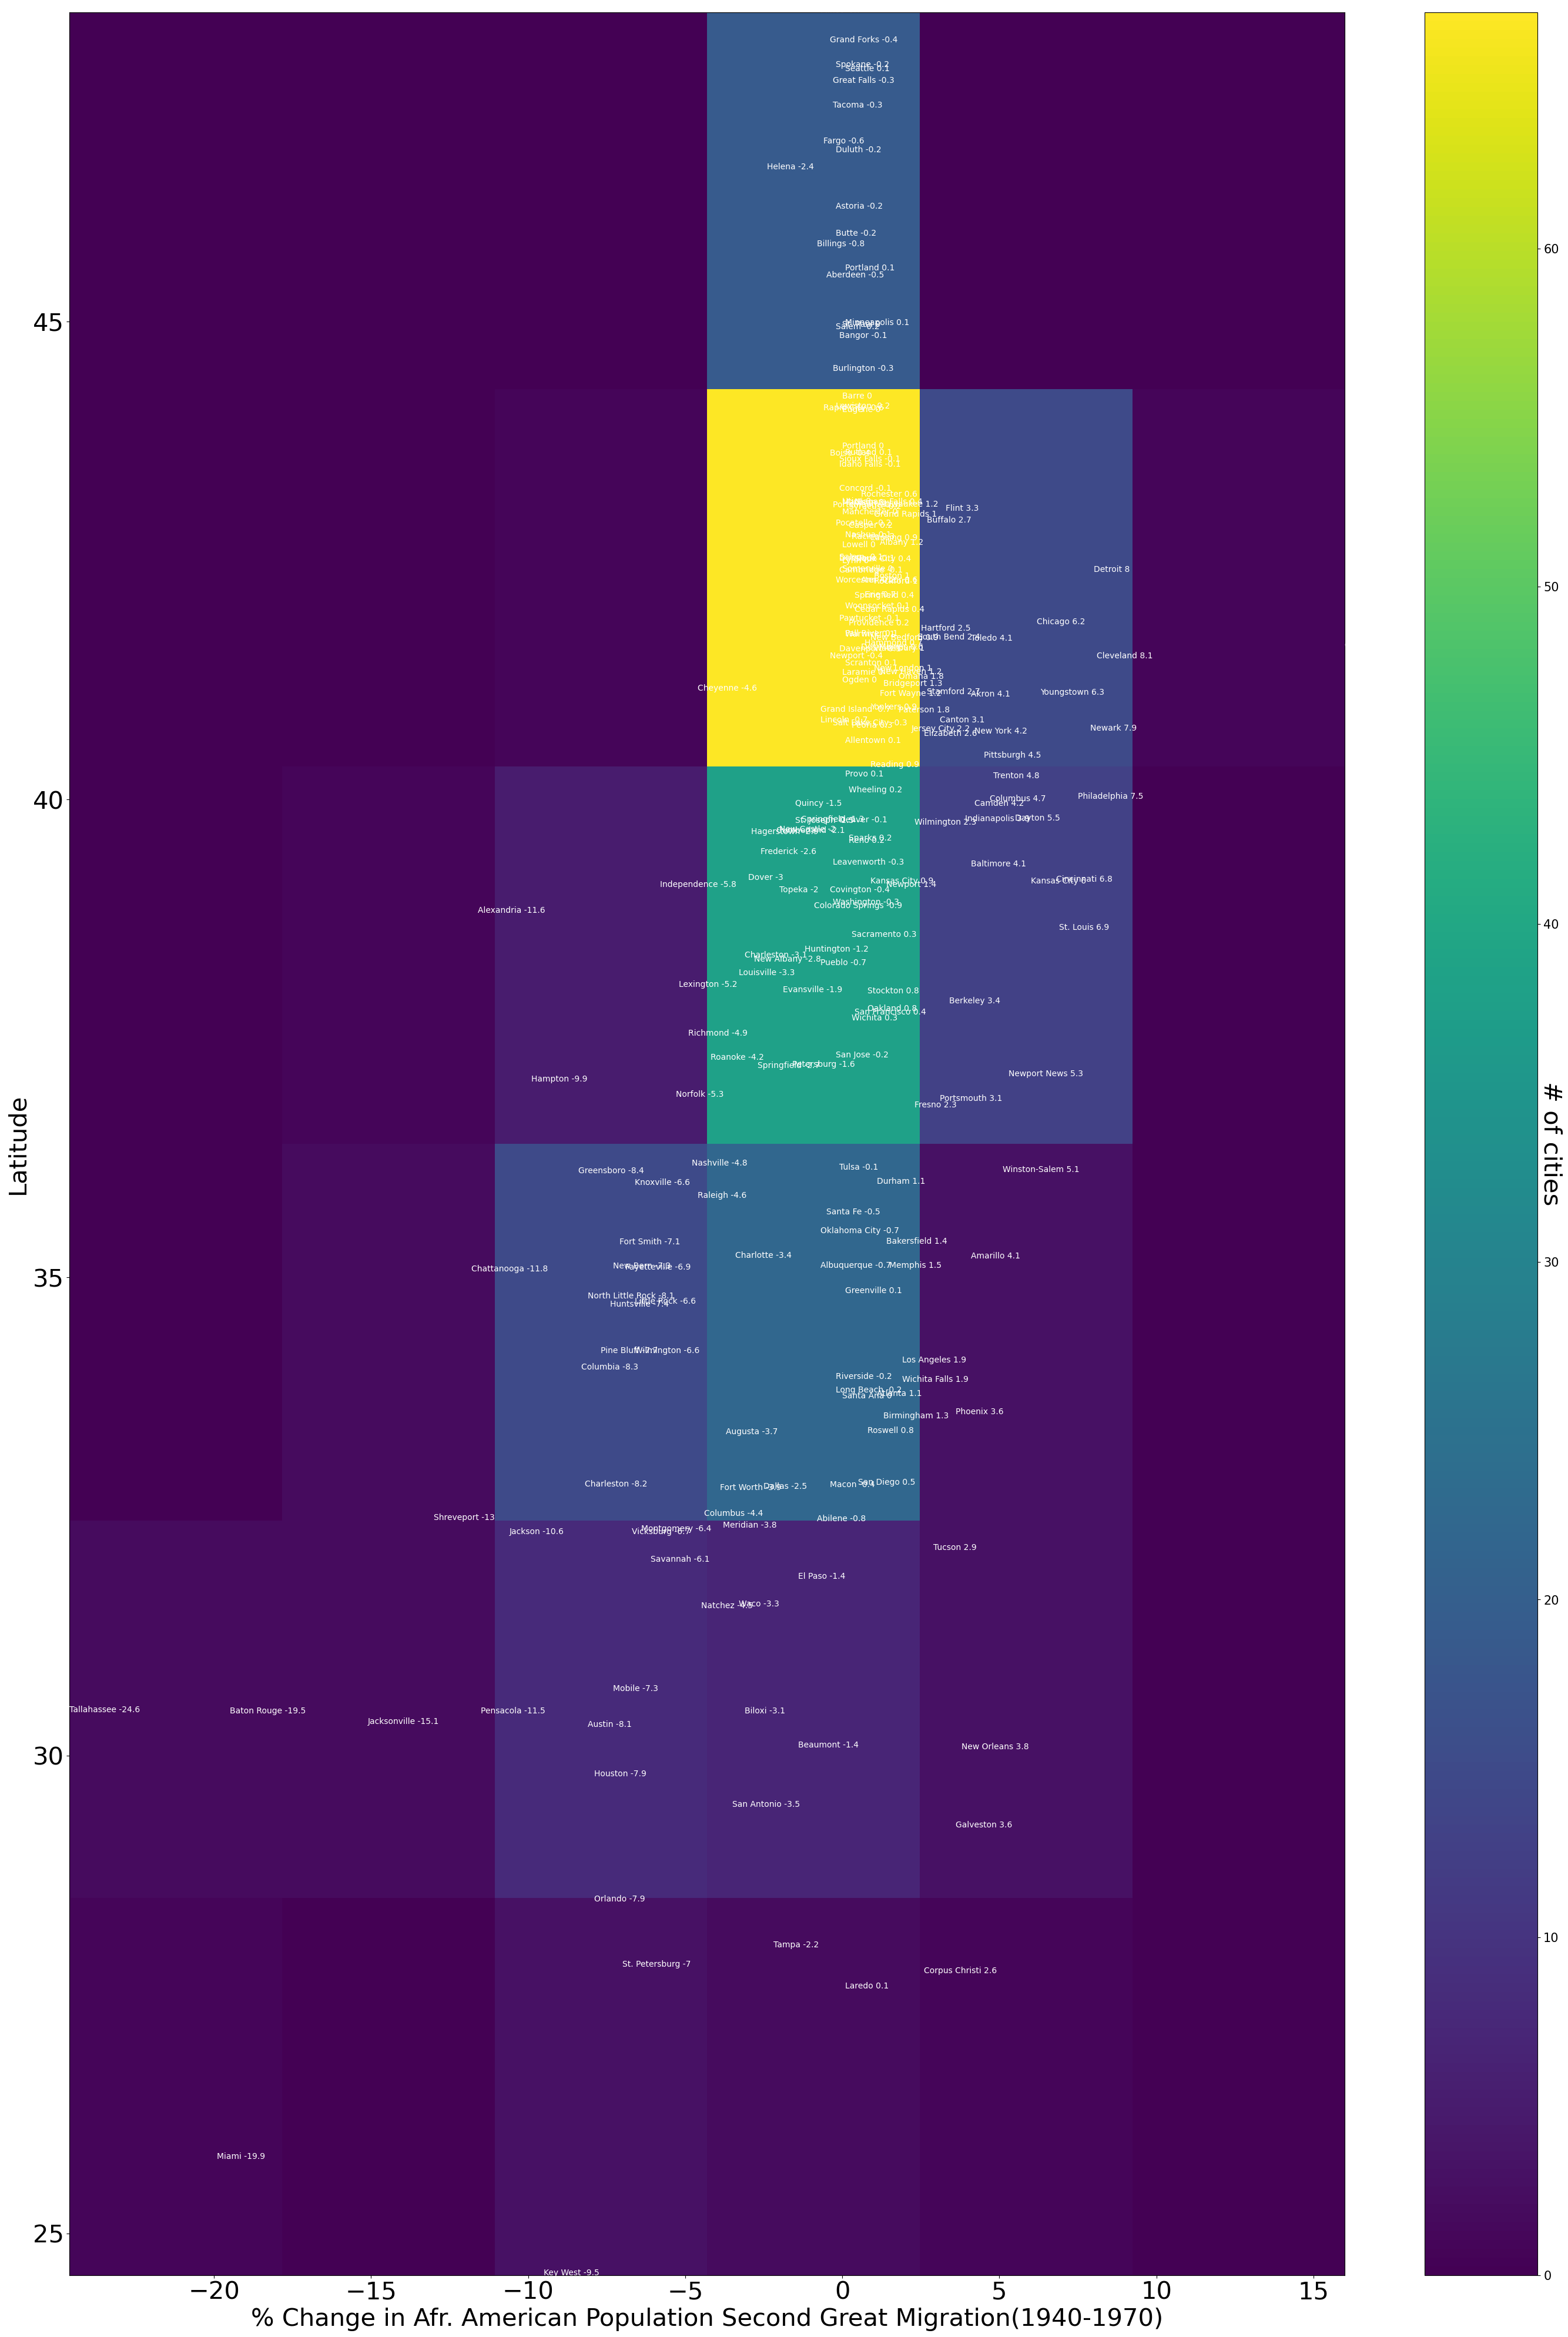
#All cities
fig=plt.figure(figsize=(35, 50))
X=df["Mig2"].astype(float)
Y=df["lat"]
heat_map= plt.hist2d(X, Y, bins=6) #heat map is a 2dimensional histogram
plt.xlabel("% Change in Afr. American Population Second Great Migration(1940-1970)",size=30)
plt.ylabel("Latitude",size=30)
plt.yticks(fontsize=30)
plt.xticks(fontsize=30)
names=df.reset_index()
for i in names.index:   ##add the names of the cities and %change in Afr. American population
    plt.text(names.Mig2[i],names.lat[i],names.city[i]+' '+str(names.Mig2[i]),fontsize=10,color='white')
cbar = plt.colorbar()
cbar.set_label('# of cities', rotation=270,size=30)
cbar.ax.tick_params(labelsize=15)
fig.savefig("Migration2.png")
#Selected Cities
fig=plt.figure(figsize=(35, 50))
X=df["Mig2"].astype(float)
Y=df["lat"]
heat_map= plt.hist2d(X, Y, bins=6,alpha=.6) #heat map is a 2dimensional histogram
plt.xlabel("% Change in Afr. American Population Second Great Migration(1940-1970)",size=30)
plt.ylabel("Latitude",size=30)
plt.yticks(fontsize=30)
plt.xticks(fontsize=30)
names=df.reset_index()
for i in names.index:   ##add the names of the cities and %change in Afr. American population
    if names.Mig2[i]<0 and any(names.loc[i,'city'] in x for x in ["Austin","Chicago","Detroit","Cleveland","Dallas","Denver","Grand Rapids","Houston","Huntsville","Indianapolis","Jacksonville","Louisville","Miami","Milwaukee","Minneapolis","Montgomery","Mobile","Nashville","New York","New Orleans","Newark","Omaha","Philadelphia","Pittsburgh","Providence","Raleigh","San Antonio","San Francisco","Seattle","St. Louis","Washington, DC",]):
        plt.text(names.Mig2[i],names.lat[i],"x"+names.city[i]+'  '+str(names.Mig2[i]),fontsize=30,color='red')
    else:
        if any(names.loc[i,'city'] in x for x in ["Chicago","Detroit","Cleveland","Dallas","Grand Rapids","Indianapolis","Louisville","Milwaukee","Minneapolis","Montgomery","Nashville","New York","Newark","Omaha","Philadelphia","Pittsburgh","Providence","Raleigh","San Francisco","Seattle","St. Louis","Washington, DC",]):
            plt.text(names.Mig2[i],names.lat[i],"x"+names.city[i]+'  '+str(names.Mig2[i]),fontsize=30,color='black')

cbar = plt.colorbar()
cbar.set_label('# of cities', rotation=270,size=50)
cbar.ax.tick_params(labelsize=25)
fig.savefig("Migration2Simplified.png")
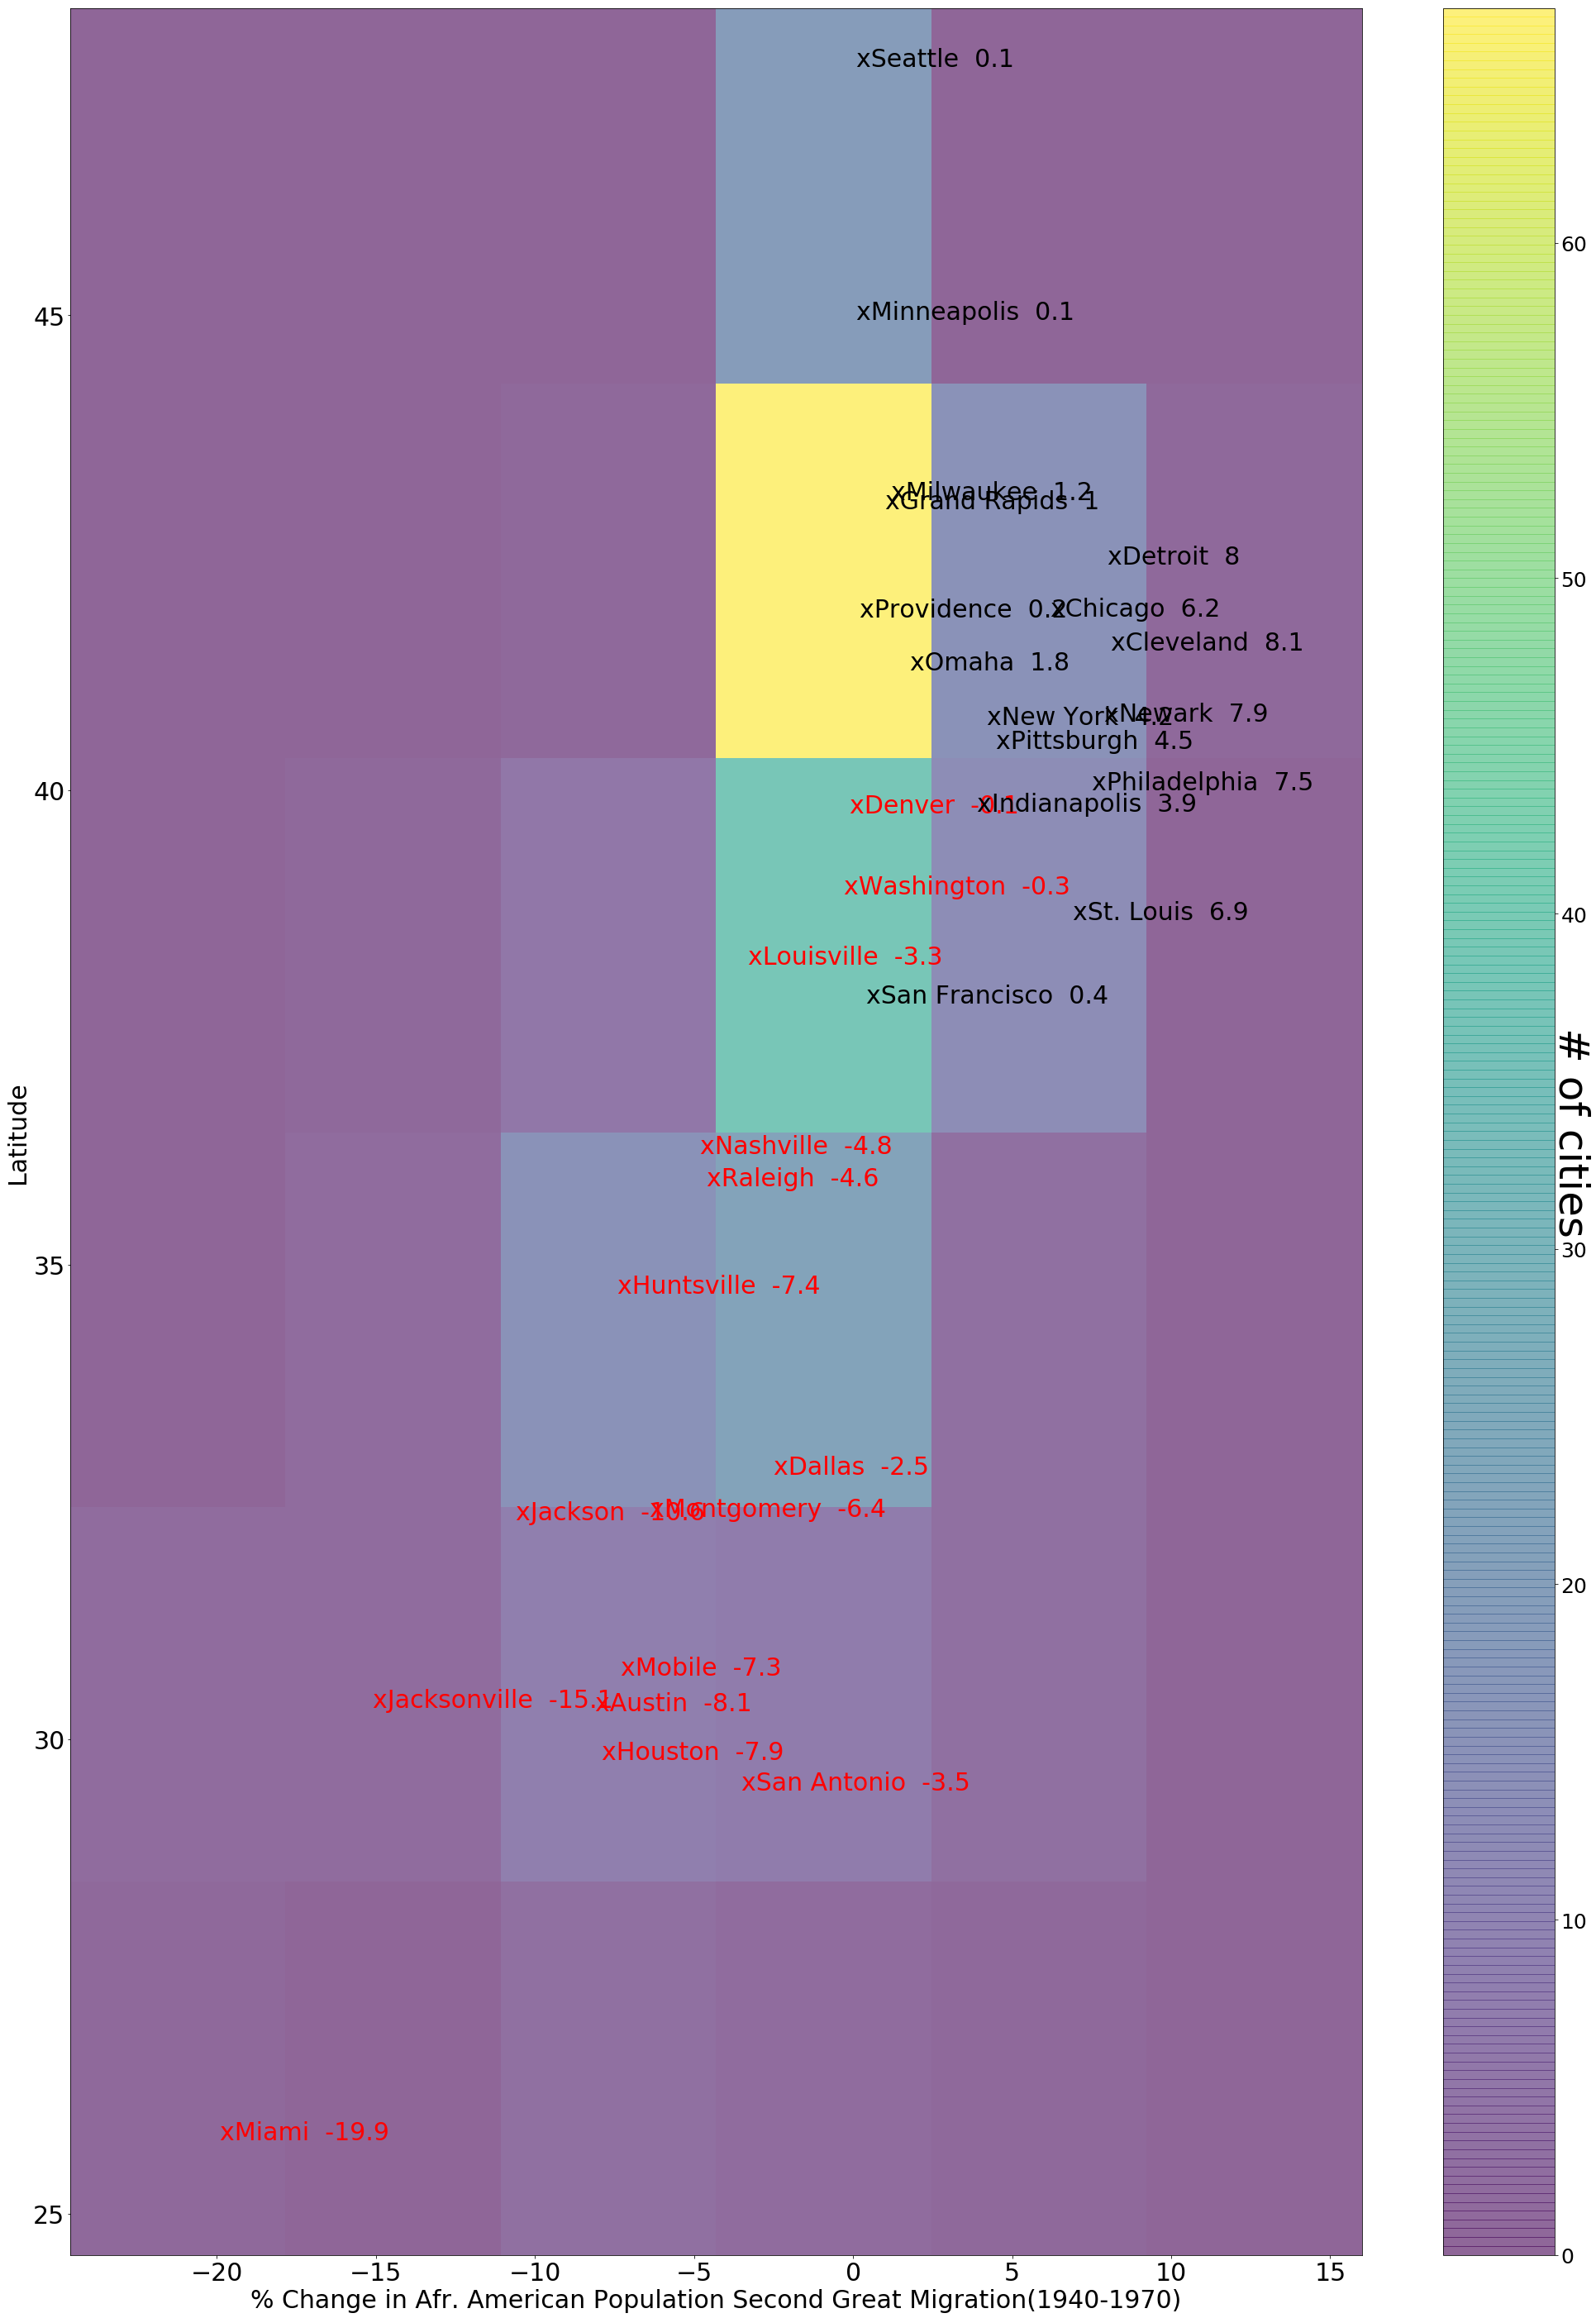
The percent changes were in general smaller in the 2nd Great Migration. For example, in Chicago the increase in African American population was 24.6% in the 1st Great Migration and 6.2% in the 2nd Great Migration.
4.3.2. Hardship Index#
raw_hardship=pd.read_excel('HIHOM20142017.xlsx')
dfHI14=raw_hardship[["Community","population(K)","HI14","UNEMP14","NOHS14","DEP14","HOUS14","POV14","INC14","HOM14","LAT","LON"]]
dfHI17=raw_hardship[["Community","population(K)","HI17","UNEMP17","NOHS17","DEP17","HOUS17","POV17","INC17","HOM17","LAT","LON"]]
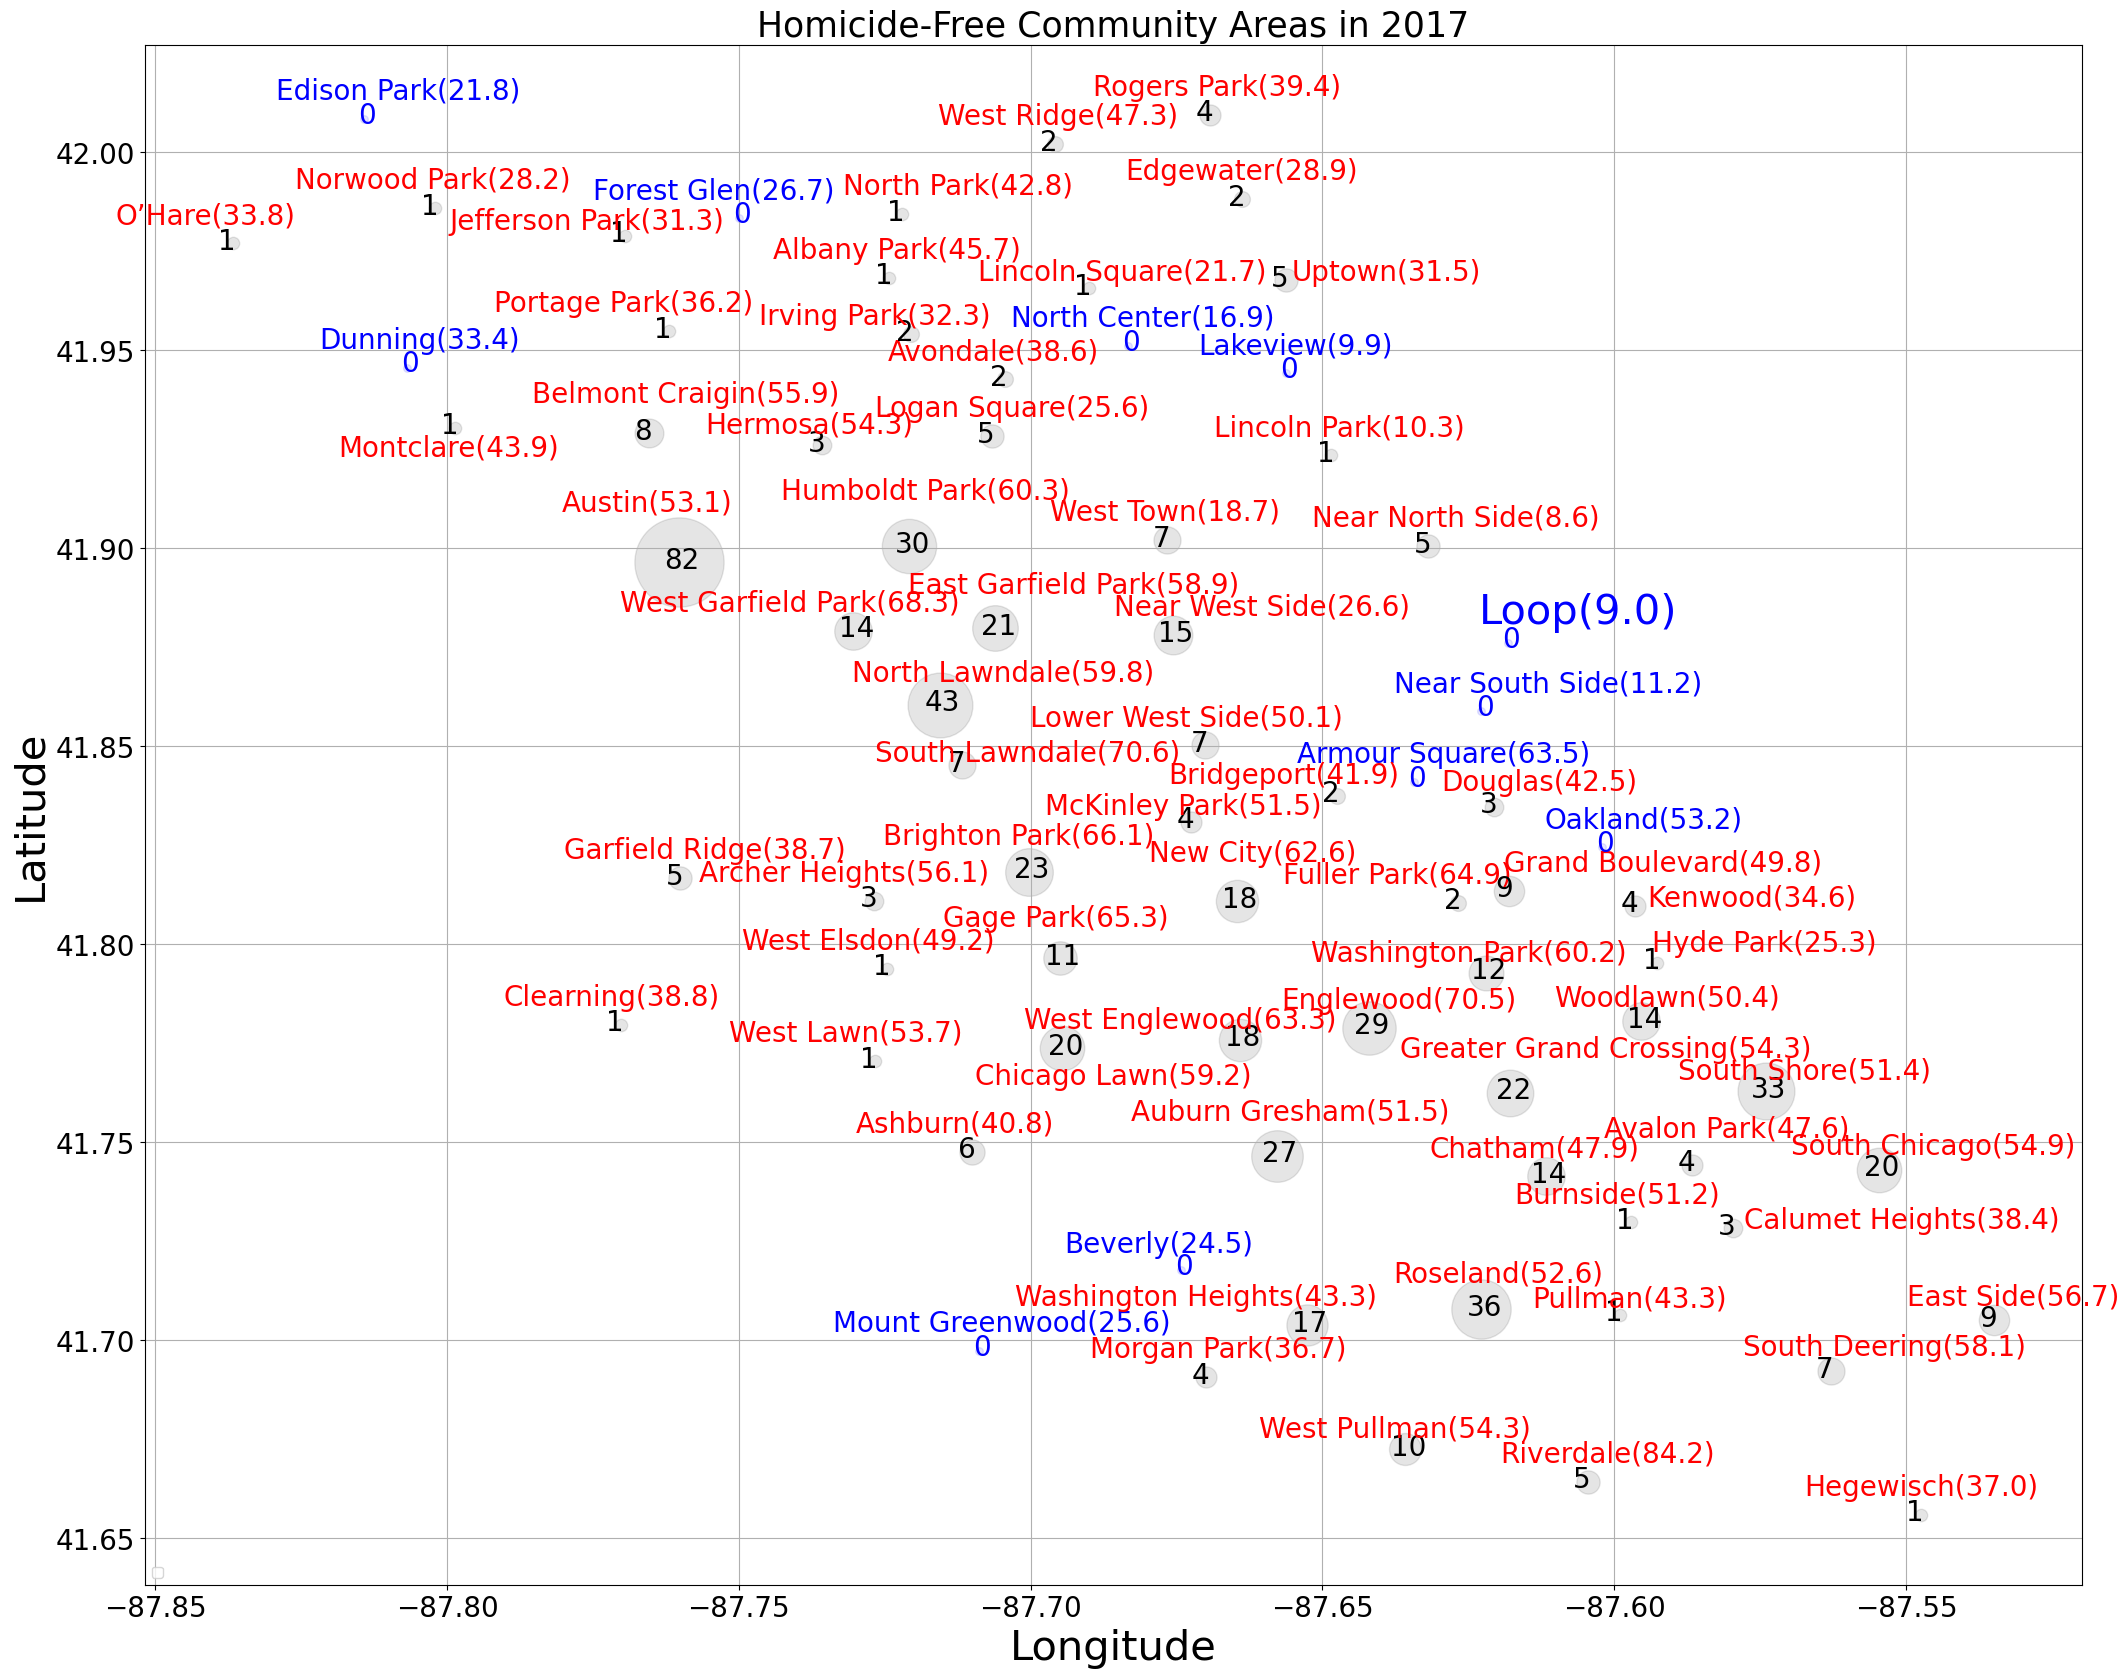
hom_df = dfHI17
fig=plt.figure(figsize=(25,20))
for i in hom_df.index:
if hom_df.loc[i,"HOM17"]==0:
plt.scatter(hom_df.loc[i,'LON'], hom_df.loc[i,'LAT'],s=30,color='b', alpha=0.1)
plt.gca().text(hom_df.loc[i,'LON']-.001, hom_df.loc[i,'LAT']-.001,str(hom_df.loc[i,'HOM17']),color='b', alpha=1,size=20)
if hom_df.loc[i,"Community"] in ["Loop"]:
plt.gca().text(hom_df.loc[i,'LON']-.005, hom_df.loc[i,'LAT']+.005, hom_df.loc[i,'Community']+'('+str(hom_df.loc[i,'HI17'])+')',color='blue', size=30)
elif hom_df.loc[i,"Community"] in ["Hyde Park","Near West Side","Kenwood","Near North Side","West Town"]:
plt.gca().text(hom_df.loc[i,'LON']+.003, hom_df.loc[i,'LAT']-.005, hom_df.loc[i,'Community']+'('+str(hom_df.loc[i,'HI17'])+')',color='blue', size=20)
elif hom_df.loc[i,"Community"] in ["Lincoln Park","Uptown","Edgewater","Rogers Park","Logan Square","Avondale"]:
plt.gca().text(hom_df.loc[i,'LON']-.015, hom_df.loc[i,'LAT']-.0075, hom_df.loc[i,'Community']+'('+str(hom_df.loc[i,'HI17'])+')',color='blue', size=20)
elif hom_df.loc[i,"Community"] in ["Lincoln Square","Irving Park","Portage Park","Jefferson Park"]:
plt.gca().text(hom_df.loc[i,'LON']-.025, hom_df.loc[i,'LAT']-.0075, hom_df.loc[i,'Community']+'('+str(hom_df.loc[i,'HI17'])+')',color='blue', size=20)
elif hom_df.loc[i,"Community"] in ["Dunning","O’Hare","Edison Park","Norwood Park"]:
plt.gca().text(hom_df.loc[i,'LON']-.015, hom_df.loc[i,'LAT']+.005, hom_df.loc[i,'Community']+'('+str(hom_df.loc[i,'HI17'])+')',color='blue', size=20)
elif hom_df.loc[i,"Community"] in ["Garfield Ridge","Clearning","Ashburn","Morgan Park"]:
plt.gca().text(hom_df.loc[i,'LON']-.015, hom_df.loc[i,'LAT']+.0015, hom_df.loc[i,'Community']+'('+str(hom_df.loc[i,'HI17'])+')',color='blue', size=20)
elif hom_df.loc[i,"Community"] in ["Hegewisch"]:
plt.gca().text(hom_df.loc[i,'LON']-.01, hom_df.loc[i,'LAT']-.0075, hom_df.loc[i,'Community']+'('+str(hom_df.loc[i,'HI17'])+')',color='blue', size=20)
elif hom_df.loc[i,"Community"] in ["Forest Glen"]:
plt.gca().text(hom_df.loc[i,'LON']-.025, hom_df.loc[i,'LAT']+.005, hom_df.loc[i,'Community']+'('+str(hom_df.loc[i,'HI17'])+')',color='blue', size=20)
elif hom_df.loc[i,"Community"] in ["North Center"]:
plt.gca().text(hom_df.loc[i,'LON']-.02, hom_df.loc[i,'LAT']+.005, hom_df.loc[i,'Community']+'('+str(hom_df.loc[i,'HI17'])+')',color='blue', size=20)
elif hom_df.loc[i,"Community"] in ["Oakland"]:
plt.gca().text(hom_df.loc[i,'LON']-.01, hom_df.loc[i,'LAT']+.005, hom_df.loc[i,'Community']+'('+str(hom_df.loc[i,'HI17'])+')',color='blue', size=20)
elif hom_df.loc[i,"Community"] in ["Mount Greenwood"]:
plt.gca().text(hom_df.loc[i,'LON']-.025, hom_df.loc[i,'LAT']+.005, hom_df.loc[i,'Community']+'('+str(hom_df.loc[i,'HI17'])+')',color='blue', size=20)
elif hom_df.loc[i,"Community"] in ["Lakeview"]:
plt.gca().text(hom_df.loc[i,'LON']-.015, hom_df.loc[i,'LAT']+.005, hom_df.loc[i,'Community']+'('+str(hom_df.loc[i,'HI17'])+')',color='blue', size=20)
elif hom_df.loc[i,"Community"] in ["Near South Side"]:
plt.gca().text(hom_df.loc[i,'LON']-.015, hom_df.loc[i,'LAT']+.005, hom_df.loc[i,'Community']+'('+str(hom_df.loc[i,'HI17'])+')',color='blue', size=20)
elif hom_df.loc[i,"Community"] in ["Edison Park"]:
plt.gca().text(hom_df.loc[i,'LON']-.015, hom_df.loc[i,'LAT']+.005, hom_df.loc[i,'Community']+'('+str(hom_df.loc[i,'HI17'])+')',color='green', size=20)
elif hom_df.loc[i,"Community"] in ["Beverly"]:
plt.gca().text(hom_df.loc[i,'LON']-.02, hom_df.loc[i,'LAT']+.0045, hom_df.loc[i,'Community']+'('+str(hom_df.loc[i,'HI17'])+')',color='blue', size=20)
else:
plt.gca().text(hom_df.loc[i,'LON']-.02,hom_df.loc[i,'LAT']+.005,hom_df.loc[i,'Community']+'('+str(hom_df.loc[i,'HI17'])+')',color='blue', size=20)
else:
plt.scatter(hom_df.loc[i,'LON'], hom_df.loc[i,'LAT'],s=30+50*hom_df.loc[i,'HOM17'],color='k', alpha=0.1)
plt.gca().text(hom_df.loc[i,'LON']-.0025, hom_df.loc[i,'LAT']-.0015,hom_df.loc[i,'HOM17'],color='k', alpha=1,size=20)
if hom_df.loc[i,"Community"] in ["Austin"]:
plt.gca().text(hom_df.loc[i,'LON']-.02,hom_df.loc[i,'LAT']+.013, hom_df.loc[i,'Community']+'('+str(hom_df.loc[i,'HI17'])+')',color='red', size=20)
elif hom_df.loc[i,"Community"] in ["Belmont Craigin"]:
plt.gca().text(hom_df.loc[i,'LON']-.02,hom_df.loc[i,'LAT']+.0078, hom_df.loc[i,'Community']+'('+str(hom_df.loc[i,'HI17'])+')',color='red', size=20)
elif hom_df.loc[i,"Community"] in ["Chicago Lawn"]:
plt.gca().text(hom_df.loc[i,'LON']-.015,hom_df.loc[i,'LAT']-.009, hom_df.loc[i,'Community']+'('+str(hom_df.loc[i,'HI17'])+')',color='red', size=20)
elif hom_df.loc[i,"Community"] in ["Pullman"]:
plt.gca().text(hom_df.loc[i,'LON']-.015,hom_df.loc[i,'LAT']+.002,hom_df.loc[i,'Community']+'('+str(hom_df.loc[i,'HI17'])+')',color='red', size=20)
elif hom_df.loc[i,"Community"] in ["Roseland"]:
plt.gca().text(hom_df.loc[i,'LON']-.015,hom_df.loc[i,'LAT']+.007,hom_df.loc[i,'Community']+'('+str(hom_df.loc[i,'HI17'])+')',color='red', size=20)
elif hom_df.loc[i,"Community"] in ["West Garfield Park"]:
plt.gca().text(hom_df.loc[i,'LON']-.04,hom_df.loc[i,'LAT']+.005,hom_df.loc[i,'Community']+'('+str(hom_df.loc[i,'HI17'])+')',color='red', size=20)
elif hom_df.loc[i,"Community"] in ["Oakland","Armour Square"]:
plt.gca().text(hom_df.loc[i,'LON']-.001,hom_df.loc[i,'LAT']+.002,hom_df.loc[i,'Community']+'('+str(hom_df.loc[i,'HI17'])+')',color='red', size=20)
elif hom_df.loc[i,"Community"] in ["Bridgeport"]:
plt.gca().text(hom_df.loc[i,'LON']-.029,hom_df.loc[i,'LAT']+.003,hom_df.loc[i,'Community']+'('+str(hom_df.loc[i,'HI17'])+')',color='red', size=20)
elif hom_df.loc[i,"Community"] in ["South Shore"]:
plt.gca().text(hom_df.loc[i,'LON']-.015,hom_df.loc[i,'LAT']+.003,hom_df.loc[i,'Community']+'('+str(hom_df.loc[i,'HI17'])+')',color='red', size=20)
elif hom_df.loc[i,"Community"] in ["West Pullman"]:
plt.gca().text(hom_df.loc[i,'LON']-.025,hom_df.loc[i,'LAT']+.003,hom_df.loc[i,'Community']+'('+str(hom_df.loc[i,'HI17'])+')',color='red', size=20)
elif hom_df.loc[i,"Community"] in ["Washington Park"]:
plt.gca().text(hom_df.loc[i,'LON']-.03,hom_df.loc[i,'LAT']+.003,hom_df.loc[i,'Community']+'('+str(hom_df.loc[i,'HI17'])+')',color='red', size=20)
elif hom_df.loc[i,"Community"] in ["Washington Heights"]:
plt.gca().text(hom_df.loc[i,'LON']-.05,hom_df.loc[i,'LAT']+.005,hom_df.loc[i,'Community']+'('+str(hom_df.loc[i,'HI17'])+')',color='red', size=20)
elif hom_df.loc[i,"Community"] in ["West Ridge","Albany Park"]:
plt.gca().text(hom_df.loc[i,'LON']-.02,hom_df.loc[i,'LAT']+.005,hom_df.loc[i,'Community']+'('+str(hom_df.loc[i,'HI17'])+')',color='red', size=20)
elif hom_df.loc[i,"Community"] in ["North Park"]:
plt.gca().text(hom_df.loc[i,'LON']-.01,hom_df.loc[i,'LAT']+.005,hom_df.loc[i,'Community']+'('+str(hom_df.loc[i,'HI17'])+')',color='red', size=20)
elif hom_df.loc[i,"Community"] in ["Lincoln Square"]:
plt.gca().text(hom_df.loc[i,'LON']-.019,hom_df.loc[i,'LAT']+.002,hom_df.loc[i,'Community']+'('+str(hom_df.loc[i,'HI17'])+')',color='red', size=20)
elif hom_df.loc[i,"Community"] in ["Hermosa"]:
plt.gca().text(hom_df.loc[i,'LON']-.02,hom_df.loc[i,'LAT']+.003,hom_df.loc[i,'Community']+'('+str(hom_df.loc[i,'HI17'])+')',color='red', size=20)
elif hom_df.loc[i,"Community"] in ["Montclare"]:
plt.gca().text(hom_df.loc[i,'LON']-.02,hom_df.loc[i,'LAT']-.007, hom_df.loc[i,'Community']+'('+str(hom_df.loc[i,'HI17'])+')',color='red', size=20)
elif hom_df.loc[i,"Community"] in ["West Town"]:
plt.gca().text(hom_df.loc[i,'LON']-.02,hom_df.loc[i,'LAT']+.005, hom_df.loc[i,'Community']+'('+str(hom_df.loc[i,'HI17'])+')',color='red', size=20)
elif hom_df.loc[i,"Community"] in ["Near West Side"]:
plt.gca().text(hom_df.loc[i,'LON']-.01,hom_df.loc[i,'LAT']+.005, hom_df.loc[i,'Community']+'('+str(hom_df.loc[i,'HI17'])+')',color='red', size=20)
elif hom_df.loc[i,"Community"] in ["Lower West Side"]:
plt.gca().text(hom_df.loc[i,'LON']-.03,hom_df.loc[i,'LAT']+.005,hom_df.loc[i,'Community']+'('+str(hom_df.loc[i,'HI17'])+')',color='red', size=20)
elif hom_df.loc[i,"Community"] in ["North Lawndale"]:
plt.gca().text(hom_df.loc[i,'LON']-.015,hom_df.loc[i,'LAT']+.006,hom_df.loc[i,'Community']+'('+str(hom_df.loc[i,'HI17'])+')',color='red', size=20)
elif hom_df.loc[i,"Community"] in ["Douglas"]:
plt.gca().text(hom_df.loc[i,'LON']-.009,hom_df.loc[i,'LAT']+.004,hom_df.loc[i,'Community']+'('+str(hom_df.loc[i,'HI17'])+')',color='red', size=20)
elif hom_df.loc[i,"Community"] in ["Archer Heights"]:
plt.gca().text(hom_df.loc[i,'LON']-.03,hom_df.loc[i,'LAT']+.005, hom_df.loc[i,'Community']+'('+str(hom_df.loc[i,'HI17'])+')',color='red', size=20)
elif hom_df.loc[i,"Community"] in ["New City"]:
plt.gca().text(hom_df.loc[i,'LON']-.015,hom_df.loc[i,'LAT']+.01, hom_df.loc[i,'Community']+'('+str(hom_df.loc[i,'HI17'])+')',color='red', size=20)
elif hom_df.loc[i,"Community"] in ["South Chicago"]:
plt.gca().text(hom_df.loc[i,'LON']-.015,hom_df.loc[i,'LAT']+.004, hom_df.loc[i,'Community']+'('+str(hom_df.loc[i,'HI17'])+')',color='red', size=20)
elif hom_df.loc[i,"Community"] in ["West Lawn"]:
plt.gca().text(hom_df.loc[i,'LON']-.025,hom_df.loc[i,'LAT']+.005, hom_df.loc[i,'Community']+'('+str(hom_df.loc[i,'HI17'])+')',color='red', size=20)
elif hom_df.loc[i,"Community"] in ["Kenwood"]:
plt.gca().text(hom_df.loc[i,'LON']+.002,hom_df.loc[i,'LAT'], hom_df.loc[i,'Community']+'('+str(hom_df.loc[i,'HI17'])+')',color='red', size=20)
elif hom_df.loc[i,"Community"] in ["Grand Boulevard"]:
plt.gca().text(hom_df.loc[i,'LON']-.001,hom_df.loc[i,'LAT']+.005,hom_df.loc[i,'Community']+'('+str(hom_df.loc[i,'HI17'])+')',color='red', size=20)
elif hom_df.loc[i,"Community"] in ["Fuller Park"]:
plt.gca().text(hom_df.loc[i,'LON']-.03,hom_df.loc[i,'LAT']+.005,hom_df.loc[i,'Community']+'('+str(hom_df.loc[i,'HI17'])+')',color='red', size=20)
elif hom_df.loc[i,"Community"] in ["Hyde Park"]:
plt.gca().text(hom_df.loc[i,'LON']-.001,hom_df.loc[i,'LAT']+.003,hom_df.loc[i,'Community']+'('+str(hom_df.loc[i,'HI17'])+')',color='red', size=20)
elif hom_df.loc[i,"Community"] in ["Calumet Heights"]:
plt.gca().text(hom_df.loc[i,'LON']+.002,hom_df.loc[i,'LAT'],hom_df.loc[i,'Community']+'('+str(hom_df.loc[i,'HI17'])+')',color='red', size=20)
elif hom_df.loc[i,"Community"] in ["Jefferson Park"]:
plt.gca().text(hom_df.loc[i,'LON']-.03,hom_df.loc[i,'LAT']+.0015,hom_df.loc[i,'Community']+'('+str(hom_df.loc[i,'HI17'])+')',color='red', size=20)
elif hom_df.loc[i,"Community"] in ["Uptown"]:
plt.gca().text(hom_df.loc[i,'LON']+.001,hom_df.loc[i,'LAT'],hom_df.loc[i,'Community']+'('+str(hom_df.loc[i,'HI17'])+')',color='red', size=20)
elif hom_df.loc[i,"Community"] in ["West Englewood"]:
plt.gca().text(hom_df.loc[i,'LON']-.037,hom_df.loc[i,'LAT']+.003,hom_df.loc[i,'Community']+'('+str(hom_df.loc[i,'HI17'])+')',color='red', size=20)
elif hom_df.loc[i,"Community"] in ["Portage Park"]:
plt.gca().text(hom_df.loc[i,'LON']-.03,hom_df.loc[i,'LAT']+.005,hom_df.loc[i,'Community']+'('+str(hom_df.loc[i,'HI17'])+')',color='red', size=20)
elif hom_df.loc[i,"Community"] in ["Irving Park"]:
plt.gca().text(hom_df.loc[i,'LON']-.026, hom_df.loc[i,'LAT']+.0025, hom_df.loc[i,'Community']+'('+str(hom_df.loc[i,'HI17'])+')',color='red', size=20)
elif hom_df.loc[i,"Community"] in ["Humboldt Park"]:
plt.gca().text(hom_df.loc[i,'LON']-.022,hom_df.loc[i,'LAT']+.012,hom_df.loc[i,'Community']+'('+str(hom_df.loc[i,'HI17'])+')',color='red', size=20)
elif hom_df.loc[i,"Community"] in ["Brighton Park"]:
plt.gca().text(hom_df.loc[i,'LON']-.025,hom_df.loc[i,'LAT']+.007, hom_df.loc[i,'Community']+'('+str(hom_df.loc[i,'HI17'])+')',color='red', size=20)
elif hom_df.loc[i,"Community"] in ["South Lawndale"]:
plt.gca().text(hom_df.loc[i,'LON']-.015,hom_df.loc[i,'LAT']+.001, hom_df.loc[i,'Community']+'('+str(hom_df.loc[i,'HI17'])+')',color='red', size=20)
elif hom_df.loc[i,"Community"] in ["McKinley Park"]:
plt.gca().text(hom_df.loc[i,'LON']-.025,hom_df.loc[i,'LAT']+.002, hom_df.loc[i,'Community']+'('+str(hom_df.loc[i,'HI17'])+')',color='red', size=20)
elif hom_df.loc[i,"Community"] in ["West Elsdon"]:
plt.gca().text(hom_df.loc[i,'LON']-.025,hom_df.loc[i,'LAT']+.005, hom_df.loc[i,'Community']+'('+str(hom_df.loc[i,'HI17'])+')',color='red', size=20)
elif hom_df.loc[i,"Community"] in ["Gage Park"]:
plt.gca().text(hom_df.loc[i,'LON']-.02,hom_df.loc[i,'LAT']+.008, hom_df.loc[i,'Community']+'('+str(hom_df.loc[i,'HI17'])+')',color='red', size=20)
elif hom_df.loc[i,"Community"] in ["Woodlawn"]:
plt.gca().text(hom_df.loc[i,'LON']-.015,hom_df.loc[i,'LAT']+.004, hom_df.loc[i,'Community']+'('+str(hom_df.loc[i,'HI17'])+')',color='red', size=20)
elif hom_df.loc[i,"Community"] in ["Englewood"]:
plt.gca().text(hom_df.loc[i,'LON']-.015,hom_df.loc[i,'LAT']+.005, hom_df.loc[i,'Community']+'('+str(hom_df.loc[i,'HI17'])+')',color='red', size=20)
elif hom_df.loc[i,"Community"] in ["Greater Grand Crossing"]:
plt.gca().text(hom_df.loc[i,'LON']-.019,hom_df.loc[i,'LAT']+.009, hom_df.loc[i,'Community']+'('+str(hom_df.loc[i,'HI17'])+')',color='red', size=20)
elif hom_df.loc[i,"Community"] in ["Auburn Gresham"]:
plt.gca().text(hom_df.loc[i,'LON']-.025,hom_df.loc[i,'LAT']+.009, hom_df.loc[i,'Community']+'('+str(hom_df.loc[i,'HI17'])+')',color='red', size=20)
elif hom_df.loc[i,"Community"] in ["Avalon Park"]:
plt.gca().text(hom_df.loc[i,'LON']-.015,hom_df.loc[i,'LAT']+.007,hom_df.loc[i,'Community']+'('+str(hom_df.loc[i,'HI17'])+')',color='red', size=20)
elif hom_df.loc[i,"Community"] in ["Burnside"]:
plt.gca().text(hom_df.loc[i,'LON']-.02,hom_df.loc[i,'LAT']+.005,hom_df.loc[i,'Community']+'('+str(hom_df.loc[i,'HI17'])+')',color='red', size=20)
elif hom_df.loc[i,"Community"] in ["East Side","South Deering"]:
plt.gca().text(hom_df.loc[i,'LON']-.015,hom_df.loc[i,'LAT']+.004, hom_df.loc[i,'Community']+'('+str(hom_df.loc[i,'HI17'])+')',color='red', size=20)
elif hom_df.loc[i,"Community"] in ["Riverdale"]:
plt.gca().text(hom_df.loc[i,'LON']-.015,hom_df.loc[i,'LAT']+.005, hom_df.loc[i,'Community']+'('+str(hom_df.loc[i,'HI17'])+')',color='red', size=20)
elif hom_df.loc[i,"Community"] in ["Norwood Park"]:
plt.gca().text(hom_df.loc[i,'LON']-.024,hom_df.loc[i,'LAT']+.005, hom_df.loc[i,'Community']+'('+str(hom_df.loc[i,'HI17'])+')',color='red', size=20)
elif hom_df.loc[i,"Community"] in ["East Garfield Park"]:
plt.gca().text(hom_df.loc[i,'LON']-.015,hom_df.loc[i,'LAT']+.009,hom_df.loc[i,'Community']+'('+str(hom_df.loc[i,'HI17'])+')',color='red', size=20)
else:
plt.gca().text(hom_df.loc[i,'LON']-.02,hom_df.loc[i,'LAT']+.005,hom_df.loc[i,'Community']+'('+str(hom_df.loc[i,'HI17'])+')',color='red', size=20)
#plt.gca().set_facecolor('lightgray')
plt.gca().grid()
plt.yticks(fontsize=20)
plt.xticks(fontsize=20)
#title
plt.title('Homicide-Free Community Areas in 2017',size=25)
plt.xlabel("Longitude",size=30)
plt.ylabel("Latitude",size=30)
plt.legend(loc="lower left")
fig.savefig("Fig5.png")
#show the plot
plt.show()
No artists with labels found to put in legend. Note that artists whose label start with an underscore are ignored when legend() is called with no argument.
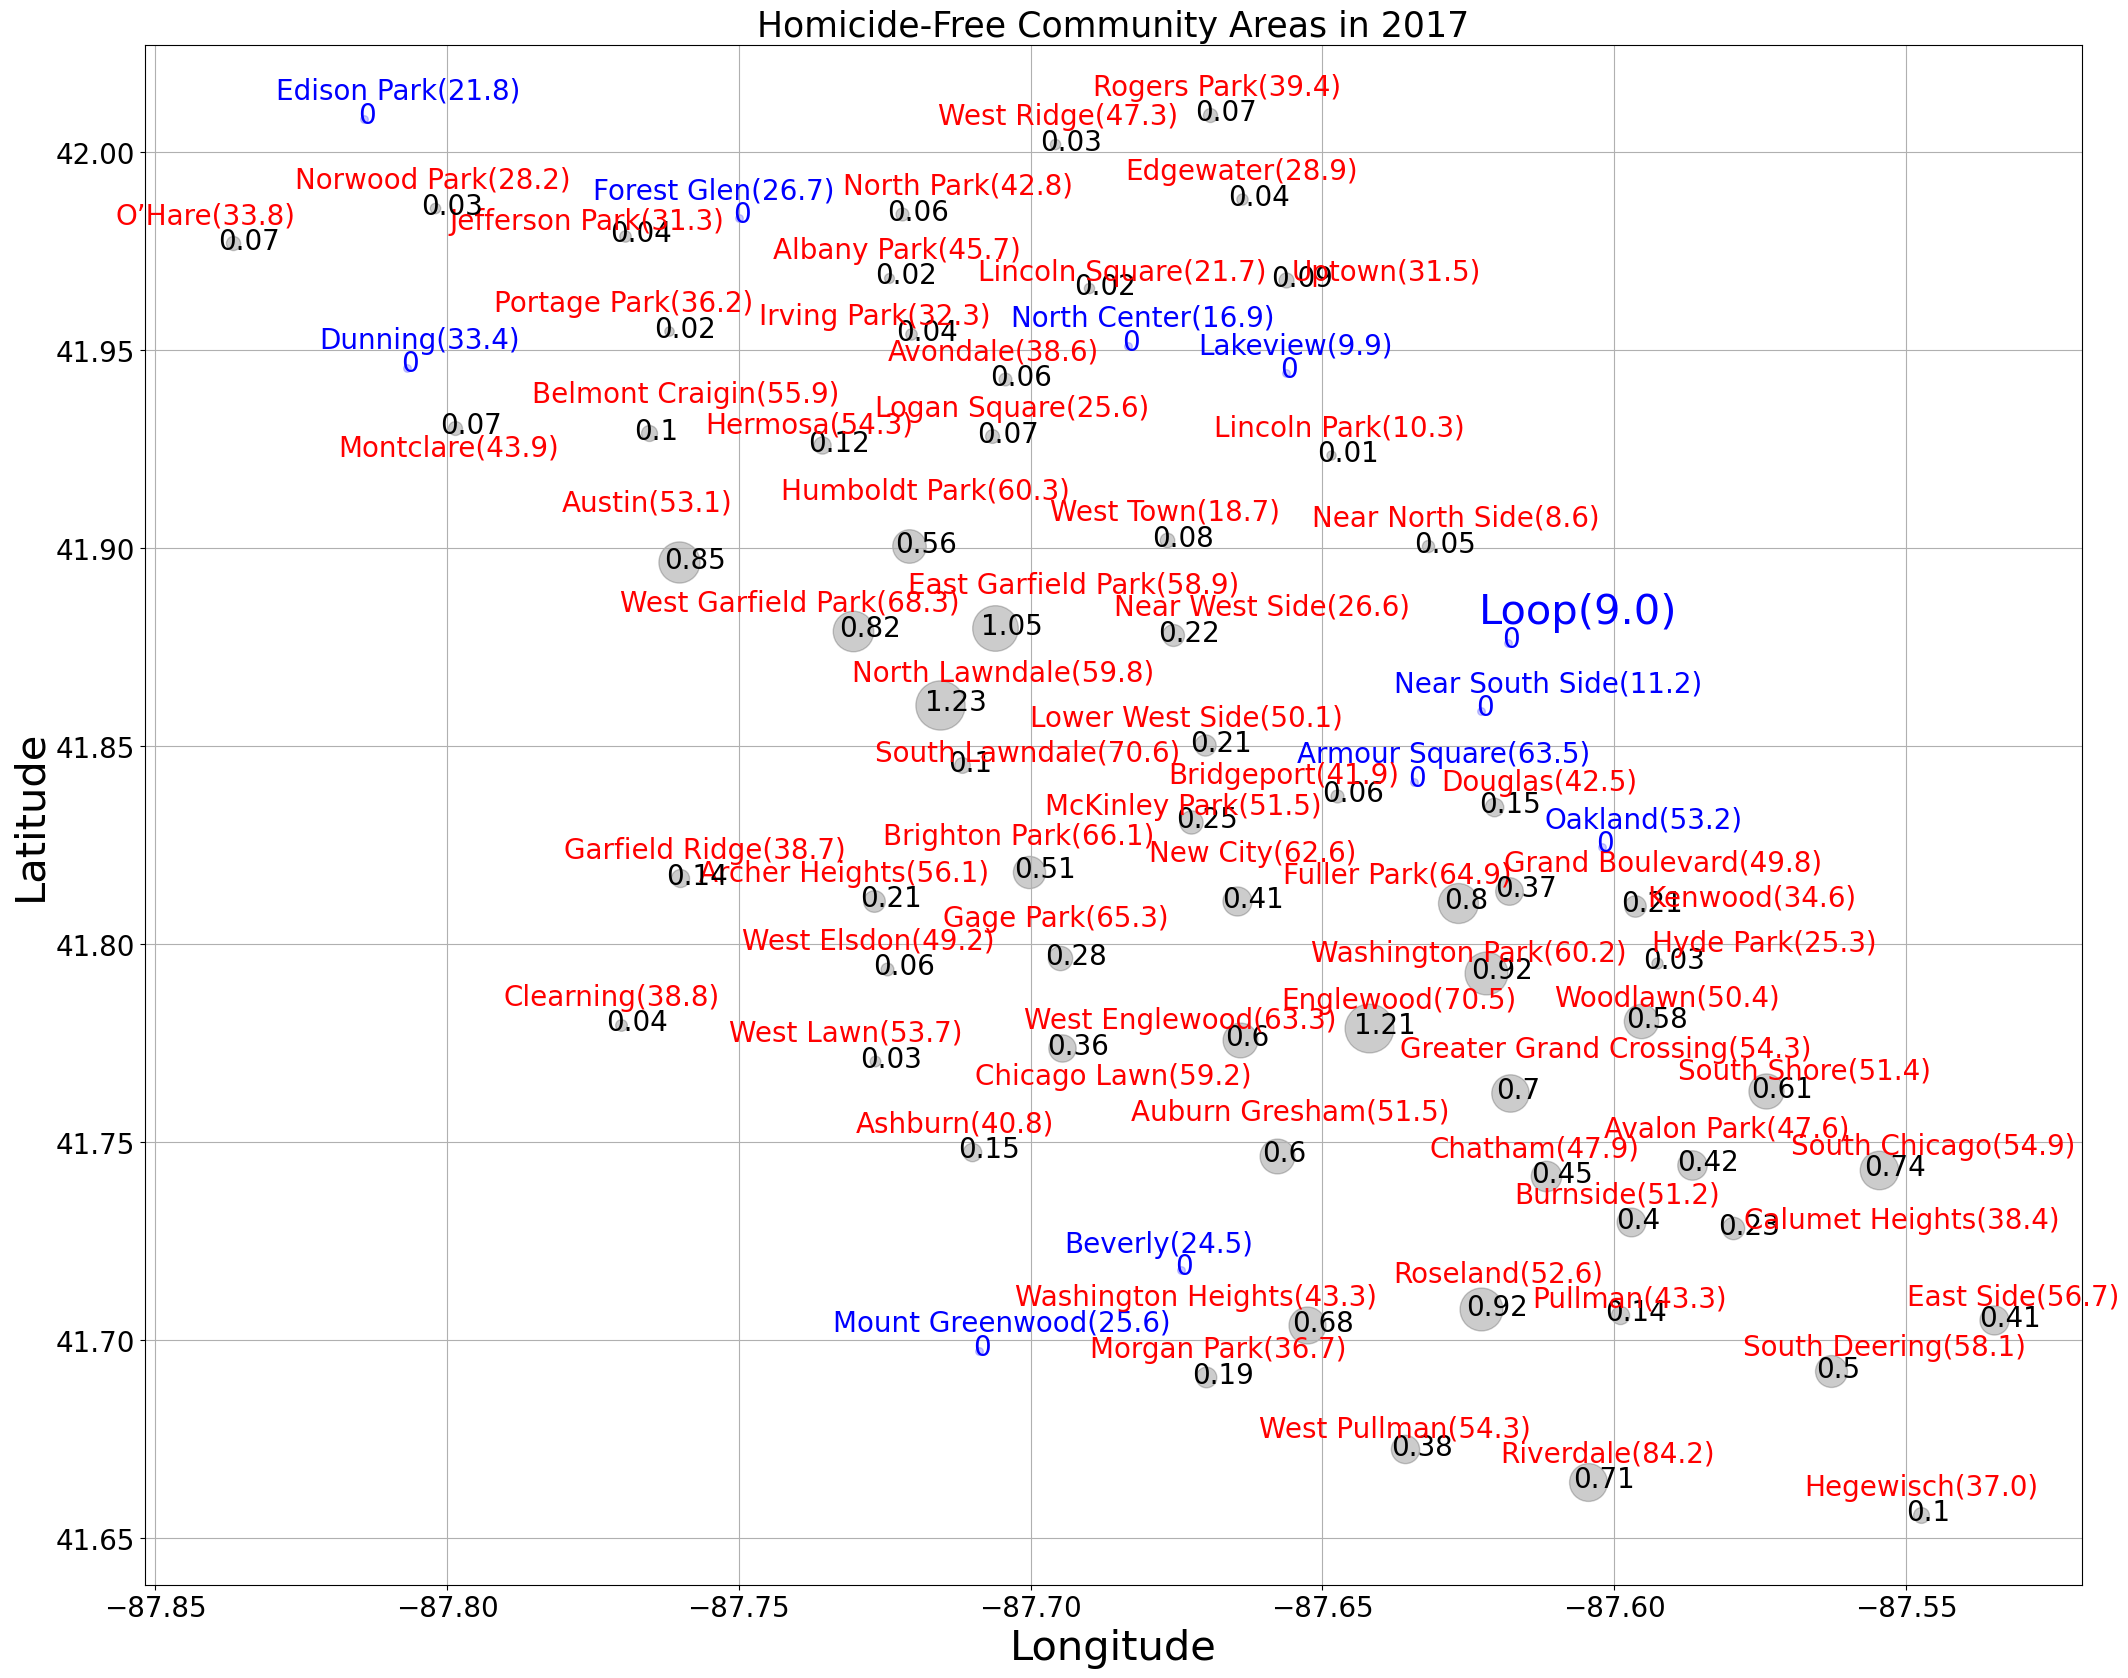
Modify the map so that the marker size and label corresponding to homicide rate rather than homicide count
fig=plt.figure(figsize=(25,20))

for i in hom_df.index:

    if hom_df.loc[i,"HOM17"]==0:
        plt.scatter(hom_df.loc[i,'LON'], hom_df.loc[i,'LAT'],s=30,color='b', alpha=0.2)
        plt.gca().text(hom_df.loc[i,'LON']-.001, hom_df.loc[i,'LAT']-.001,hom_df.loc[i,'HOM17'],color='b', alpha=1,size=20)
        if hom_df.loc[i,"Community"] in ["Loop"]:
            plt.gca().text(hom_df.loc[i,'LON']-.005, hom_df.loc[i,'LAT']+.005, hom_df.loc[i,'Community']+'('+str(hom_df.loc[i,'HI17'])+')',color='blue', size=30)
        elif hom_df.loc[i,"Community"] in ["Hyde Park","Near West Side","Kenwood","Near North Side","West Town"]:
            plt.gca().text(hom_df.loc[i,'LON']+.003, hom_df.loc[i,'LAT']-.005, hom_df.loc[i,'Community']+'('+str(hom_df.loc[i,'HI17'])+')',color='blue', size=20)
        elif hom_df.loc[i,"Community"] in ["Lincoln Park","Uptown","Edgewater","Rogers Park","Logan Square","Avondale"]:
            plt.gca().text(hom_df.loc[i,'LON']-.015, hom_df.loc[i,'LAT']-.0075, hom_df.loc[i,'Community']+'('+str(hom_df.loc[i,'HI17'])+')',color='blue', size=20)
        elif hom_df.loc[i,"Community"] in ["Lincoln Square","Irving Park","Portage Park","Jefferson Park"]:
            plt.gca().text(hom_df.loc[i,'LON']-.025, hom_df.loc[i,'LAT']-.0075, hom_df.loc[i,'Community']+'('+str(hom_df.loc[i,'HI17'])+')',color='blue', size=20)
        elif hom_df.loc[i,"Community"] in ["Dunning","O’Hare","Edison Park","Norwood Park"]:
            plt.gca().text(hom_df.loc[i,'LON']-.015, hom_df.loc[i,'LAT']+.005, hom_df.loc[i,'Community']+'('+str(hom_df.loc[i,'HI17'])+')',color='blue', size=20)

        elif hom_df.loc[i,"Community"] in ["Garfield Ridge","Clearning","Ashburn","Morgan Park"]:
            plt.gca().text(hom_df.loc[i,'LON']-.015, hom_df.loc[i,'LAT']+.0015, hom_df.loc[i,'Community']+'('+str(hom_df.loc[i,'HI17'])+')',color='blue', size=20)
        elif hom_df.loc[i,"Community"] in ["Hegewisch"]:
            plt.gca().text(hom_df.loc[i,'LON']-.01, hom_df.loc[i,'LAT']-.0075, hom_df.loc[i,'Community']+'('+str(hom_df.loc[i,'HI17'])+')',color='blue', size=20)
        elif hom_df.loc[i,"Community"] in ["Forest Glen"]:
            plt.gca().text(hom_df.loc[i,'LON']-.025, hom_df.loc[i,'LAT']+.005, hom_df.loc[i,'Community']+'('+str(hom_df.loc[i,'HI17'])+')',color='blue', size=20)
        elif hom_df.loc[i,"Community"] in ["North Center"]:
            plt.gca().text(hom_df.loc[i,'LON']-.02, hom_df.loc[i,'LAT']+.005, hom_df.loc[i,'Community']+'('+str(hom_df.loc[i,'HI17'])+')',color='blue', size=20)
        elif hom_df.loc[i,"Community"] in ["Oakland"]:
            plt.gca().text(hom_df.loc[i,'LON']-.01, hom_df.loc[i,'LAT']+.005, hom_df.loc[i,'Community']+'('+str(hom_df.loc[i,'HI17'])+')',color='blue', size=20)
        elif hom_df.loc[i,"Community"] in ["Mount Greenwood"]:
            plt.gca().text(hom_df.loc[i,'LON']-.025, hom_df.loc[i,'LAT']+.005, hom_df.loc[i,'Community']+'('+str(hom_df.loc[i,'HI17'])+')',color='blue', size=20)
        elif hom_df.loc[i,"Community"] in ["Lakeview"]:
            plt.gca().text(hom_df.loc[i,'LON']-.015, hom_df.loc[i,'LAT']+.005, hom_df.loc[i,'Community']+'('+str(hom_df.loc[i,'HI17'])+')',color='blue', size=20)
        elif hom_df.loc[i,"Community"] in ["Near South Side"]:
            plt.gca().text(hom_df.loc[i,'LON']-.015, hom_df.loc[i,'LAT']+.005, hom_df.loc[i,'Community']+'('+str(hom_df.loc[i,'HI17'])+')',color='blue', size=20)

        elif hom_df.loc[i,"Community"] in ["Edison Park"]:
            plt.gca().text(hom_df.loc[i,'LON']-.015, hom_df.loc[i,'LAT']+.005, hom_df.loc[i,'Community']+'('+str(hom_df.loc[i,'HI17'])+')',color='green', size=20)
        elif hom_df.loc[i,"Community"] in ["Beverly"]:
            plt.gca().text(hom_df.loc[i,'LON']-.02, hom_df.loc[i,'LAT']+.0045, hom_df.loc[i,'Community']+'('+str(hom_df.loc[i,'HI17'])+')',color='blue', size=20)


        else:
            plt.gca().text(hom_df.loc[i,'LON']-.02,hom_df.loc[i,'LAT']+.005,hom_df.loc[i,'Community']+'('+str(hom_df.loc[i,'HI17'])+')',color='blue', size=20)

    else:
        p=hom_df.loc[i,'population(K)']
        plt.scatter(hom_df.loc[i,'LON'], hom_df.loc[i,'LAT'],s=30+1000*hom_df.loc[i,'HOM17']/p,color='k', alpha=0.2)
        plt.gca().text(hom_df.loc[i,'LON']-.0025, hom_df.loc[i,'LAT']-.0015,str(round(hom_df.loc[i,'HOM17']/p,2)),color='k', alpha=1,size=20)
        if hom_df.loc[i,"Community"] in ["Austin"]:
            plt.gca().text(hom_df.loc[i,'LON']-.02,hom_df.loc[i,'LAT']+.013, hom_df.loc[i,'Community']+'('+str(hom_df.loc[i,'HI17'])+')',color='red', size=20)
        elif hom_df.loc[i,"Community"] in ["Belmont Craigin"]:
            plt.gca().text(hom_df.loc[i,'LON']-.02,hom_df.loc[i,'LAT']+.0078, hom_df.loc[i,'Community']+'('+str(hom_df.loc[i,'HI17'])+')',color='red', size=20)
        elif hom_df.loc[i,"Community"] in ["Chicago Lawn"]:
            plt.gca().text(hom_df.loc[i,'LON']-.015,hom_df.loc[i,'LAT']-.009, hom_df.loc[i,'Community']+'('+str(hom_df.loc[i,'HI17'])+')',color='red', size=20)
        elif hom_df.loc[i,"Community"] in ["Pullman"]:
            plt.gca().text(hom_df.loc[i,'LON']-.015,hom_df.loc[i,'LAT']+.002,hom_df.loc[i,'Community']+'('+str(hom_df.loc[i,'HI17'])+')',color='red', size=20)
        elif hom_df.loc[i,"Community"] in ["Roseland"]:
            plt.gca().text(hom_df.loc[i,'LON']-.015,hom_df.loc[i,'LAT']+.007,hom_df.loc[i,'Community']+'('+str(hom_df.loc[i,'HI17'])+')',color='red', size=20)
        elif hom_df.loc[i,"Community"] in ["West Garfield Park"]:
            plt.gca().text(hom_df.loc[i,'LON']-.04,hom_df.loc[i,'LAT']+.005,hom_df.loc[i,'Community']+'('+str(hom_df.loc[i,'HI17'])+')',color='red', size=20)
        elif hom_df.loc[i,"Community"] in ["Oakland","Armour Square"]:
            plt.gca().text(hom_df.loc[i,'LON']-.001,hom_df.loc[i,'LAT']+.002,hom_df.loc[i,'Community']+'('+str(hom_df.loc[i,'HI17'])+')',color='red', size=20)
        elif hom_df.loc[i,"Community"] in ["Bridgeport"]:
            plt.gca().text(hom_df.loc[i,'LON']-.029,hom_df.loc[i,'LAT']+.003,hom_df.loc[i,'Community']+'('+str(hom_df.loc[i,'HI17'])+')',color='red', size=20)
        elif hom_df.loc[i,"Community"] in ["South Shore"]:
            plt.gca().text(hom_df.loc[i,'LON']-.015,hom_df.loc[i,'LAT']+.003,hom_df.loc[i,'Community']+'('+str(hom_df.loc[i,'HI17'])+')',color='red', size=20)
        elif hom_df.loc[i,"Community"] in ["West Pullman"]:
            plt.gca().text(hom_df.loc[i,'LON']-.025,hom_df.loc[i,'LAT']+.003,hom_df.loc[i,'Community']+'('+str(hom_df.loc[i,'HI17'])+')',color='red', size=20)
        elif hom_df.loc[i,"Community"] in ["Washington Park"]:
            plt.gca().text(hom_df.loc[i,'LON']-.03,hom_df.loc[i,'LAT']+.003,hom_df.loc[i,'Community']+'('+str(hom_df.loc[i,'HI17'])+')',color='red', size=20)

        elif hom_df.loc[i,"Community"] in ["Washington Heights"]:
            plt.gca().text(hom_df.loc[i,'LON']-.05,hom_df.loc[i,'LAT']+.005,hom_df.loc[i,'Community']+'('+str(hom_df.loc[i,'HI17'])+')',color='red', size=20)
        elif hom_df.loc[i,"Community"] in ["West Ridge","Albany Park"]:
            plt.gca().text(hom_df.loc[i,'LON']-.02,hom_df.loc[i,'LAT']+.005,hom_df.loc[i,'Community']+'('+str(hom_df.loc[i,'HI17'])+')',color='red', size=20)
        elif hom_df.loc[i,"Community"] in ["North Park"]:
            plt.gca().text(hom_df.loc[i,'LON']-.01,hom_df.loc[i,'LAT']+.005,hom_df.loc[i,'Community']+'('+str(hom_df.loc[i,'HI17'])+')',color='red', size=20)
        elif hom_df.loc[i,"Community"] in ["Lincoln Square"]:
            plt.gca().text(hom_df.loc[i,'LON']-.019,hom_df.loc[i,'LAT']+.002,hom_df.loc[i,'Community']+'('+str(hom_df.loc[i,'HI17'])+')',color='red', size=20)
        elif hom_df.loc[i,"Community"] in ["Hermosa"]:
            plt.gca().text(hom_df.loc[i,'LON']-.02,hom_df.loc[i,'LAT']+.003,hom_df.loc[i,'Community']+'('+str(hom_df.loc[i,'HI17'])+')',color='red', size=20)
        elif hom_df.loc[i,"Community"] in ["Montclare"]:
            plt.gca().text(hom_df.loc[i,'LON']-.02,hom_df.loc[i,'LAT']-.007, hom_df.loc[i,'Community']+'('+str(hom_df.loc[i,'HI17'])+')',color='red', size=20)
        elif hom_df.loc[i,"Community"] in ["West Town"]:
            plt.gca().text(hom_df.loc[i,'LON']-.02,hom_df.loc[i,'LAT']+.005, hom_df.loc[i,'Community']+'('+str(hom_df.loc[i,'HI17'])+')',color='red', size=20)
        elif hom_df.loc[i,"Community"] in ["Near West Side"]:
            plt.gca().text(hom_df.loc[i,'LON']-.01,hom_df.loc[i,'LAT']+.005, hom_df.loc[i,'Community']+'('+str(hom_df.loc[i,'HI17'])+')',color='red', size=20)
        elif hom_df.loc[i,"Community"] in ["Lower West Side"]:
            plt.gca().text(hom_df.loc[i,'LON']-.03,hom_df.loc[i,'LAT']+.005,hom_df.loc[i,'Community']+'('+str(hom_df.loc[i,'HI17'])+')',color='red', size=20)
        elif hom_df.loc[i,"Community"] in ["North Lawndale"]:
            plt.gca().text(hom_df.loc[i,'LON']-.015,hom_df.loc[i,'LAT']+.006,hom_df.loc[i,'Community']+'('+str(hom_df.loc[i,'HI17'])+')',color='red', size=20)
        elif hom_df.loc[i,"Community"] in ["Douglas"]:
            plt.gca().text(hom_df.loc[i,'LON']-.009,hom_df.loc[i,'LAT']+.004,hom_df.loc[i,'Community']+'('+str(hom_df.loc[i,'HI17'])+')',color='red', size=20)
        elif hom_df.loc[i,"Community"] in ["Archer Heights"]:
            plt.gca().text(hom_df.loc[i,'LON']-.03,hom_df.loc[i,'LAT']+.005, hom_df.loc[i,'Community']+'('+str(hom_df.loc[i,'HI17'])+')',color='red', size=20)
        elif hom_df.loc[i,"Community"] in ["New City"]:
            plt.gca().text(hom_df.loc[i,'LON']-.015,hom_df.loc[i,'LAT']+.01, hom_df.loc[i,'Community']+'('+str(hom_df.loc[i,'HI17'])+')',color='red', size=20)
        elif hom_df.loc[i,"Community"] in ["South Chicago"]:
            plt.gca().text(hom_df.loc[i,'LON']-.015,hom_df.loc[i,'LAT']+.004, hom_df.loc[i,'Community']+'('+str(hom_df.loc[i,'HI17'])+')',color='red', size=20)
        elif hom_df.loc[i,"Community"] in ["West Lawn"]:
            plt.gca().text(hom_df.loc[i,'LON']-.025,hom_df.loc[i,'LAT']+.005, hom_df.loc[i,'Community']+'('+str(hom_df.loc[i,'HI17'])+')',color='red', size=20)
        elif hom_df.loc[i,"Community"] in ["Kenwood"]:
            plt.gca().text(hom_df.loc[i,'LON']+.002,hom_df.loc[i,'LAT'], hom_df.loc[i,'Community']+'('+str(hom_df.loc[i,'HI17'])+')',color='red', size=20)
        elif hom_df.loc[i,"Community"] in ["Grand Boulevard"]:
            plt.gca().text(hom_df.loc[i,'LON']-.001,hom_df.loc[i,'LAT']+.005,hom_df.loc[i,'Community']+'('+str(hom_df.loc[i,'HI17'])+')',color='red', size=20)
        elif hom_df.loc[i,"Community"] in ["Fuller Park"]:
            plt.gca().text(hom_df.loc[i,'LON']-.03,hom_df.loc[i,'LAT']+.005,hom_df.loc[i,'Community']+'('+str(hom_df.loc[i,'HI17'])+')',color='red', size=20)
        elif hom_df.loc[i,"Community"] in ["Hyde Park"]:
            plt.gca().text(hom_df.loc[i,'LON']-.001,hom_df.loc[i,'LAT']+.003,hom_df.loc[i,'Community']+'('+str(hom_df.loc[i,'HI17'])+')',color='red', size=20)
        elif hom_df.loc[i,"Community"] in ["Calumet Heights"]:
            plt.gca().text(hom_df.loc[i,'LON']+.002,hom_df.loc[i,'LAT'],hom_df.loc[i,'Community']+'('+str(hom_df.loc[i,'HI17'])+')',color='red', size=20)
        elif hom_df.loc[i,"Community"] in ["Jefferson Park"]:
            plt.gca().text(hom_df.loc[i,'LON']-.03,hom_df.loc[i,'LAT']+.0015,hom_df.loc[i,'Community']+'('+str(hom_df.loc[i,'HI17'])+')',color='red', size=20)
        elif hom_df.loc[i,"Community"] in ["Uptown"]:
            plt.gca().text(hom_df.loc[i,'LON']+.001,hom_df.loc[i,'LAT'],hom_df.loc[i,'Community']+'('+str(hom_df.loc[i,'HI17'])+')',color='red', size=20)
        elif hom_df.loc[i,"Community"] in ["West Englewood"]:
            plt.gca().text(hom_df.loc[i,'LON']-.037,hom_df.loc[i,'LAT']+.003,hom_df.loc[i,'Community']+'('+str(hom_df.loc[i,'HI17'])+')',color='red', size=20)
        elif hom_df.loc[i,"Community"] in ["Portage Park"]:
            plt.gca().text(hom_df.loc[i,'LON']-.03,hom_df.loc[i,'LAT']+.005,hom_df.loc[i,'Community']+'('+str(hom_df.loc[i,'HI17'])+')',color='red', size=20)
        elif hom_df.loc[i,"Community"] in ["Irving Park"]:
            plt.gca().text(hom_df.loc[i,'LON']-.026, hom_df.loc[i,'LAT']+.0025, hom_df.loc[i,'Community']+'('+str(hom_df.loc[i,'HI17'])+')',color='red', size=20)
        elif hom_df.loc[i,"Community"] in ["Humboldt Park"]:
            plt.gca().text(hom_df.loc[i,'LON']-.022,hom_df.loc[i,'LAT']+.012,hom_df.loc[i,'Community']+'('+str(hom_df.loc[i,'HI17'])+')',color='red', size=20)
        elif hom_df.loc[i,"Community"] in ["Brighton Park"]:
            plt.gca().text(hom_df.loc[i,'LON']-.025,hom_df.loc[i,'LAT']+.007, hom_df.loc[i,'Community']+'('+str(hom_df.loc[i,'HI17'])+')',color='red', size=20)
        elif hom_df.loc[i,"Community"] in ["South Lawndale"]:
            plt.gca().text(hom_df.loc[i,'LON']-.015,hom_df.loc[i,'LAT']+.001, hom_df.loc[i,'Community']+'('+str(hom_df.loc[i,'HI17'])+')',color='red', size=20)
        elif hom_df.loc[i,"Community"] in ["McKinley Park"]:
            plt.gca().text(hom_df.loc[i,'LON']-.025,hom_df.loc[i,'LAT']+.002, hom_df.loc[i,'Community']+'('+str(hom_df.loc[i,'HI17'])+')',color='red', size=20)
        elif hom_df.loc[i,"Community"] in ["West Elsdon"]:
            plt.gca().text(hom_df.loc[i,'LON']-.025,hom_df.loc[i,'LAT']+.005, hom_df.loc[i,'Community']+'('+str(hom_df.loc[i,'HI17'])+')',color='red', size=20)
        elif hom_df.loc[i,"Community"] in ["Gage Park"]:
            plt.gca().text(hom_df.loc[i,'LON']-.02,hom_df.loc[i,'LAT']+.008, hom_df.loc[i,'Community']+'('+str(hom_df.loc[i,'HI17'])+')',color='red', size=20)
        elif hom_df.loc[i,"Community"] in ["Woodlawn"]:
            plt.gca().text(hom_df.loc[i,'LON']-.015,hom_df.loc[i,'LAT']+.004, hom_df.loc[i,'Community']+'('+str(hom_df.loc[i,'HI17'])+')',color='red', size=20)
        elif hom_df.loc[i,"Community"] in ["Englewood"]:
            plt.gca().text(hom_df.loc[i,'LON']-.015,hom_df.loc[i,'LAT']+.005, hom_df.loc[i,'Community']+'('+str(hom_df.loc[i,'HI17'])+')',color='red', size=20)
        elif hom_df.loc[i,"Community"] in ["Greater Grand Crossing"]:
            plt.gca().text(hom_df.loc[i,'LON']-.019,hom_df.loc[i,'LAT']+.009, hom_df.loc[i,'Community']+'('+str(hom_df.loc[i,'HI17'])+')',color='red', size=20)
        elif hom_df.loc[i,"Community"] in ["Auburn Gresham"]:
            plt.gca().text(hom_df.loc[i,'LON']-.025,hom_df.loc[i,'LAT']+.009, hom_df.loc[i,'Community']+'('+str(hom_df.loc[i,'HI17'])+')',color='red', size=20)
        elif hom_df.loc[i,"Community"] in ["Avalon Park"]:
            plt.gca().text(hom_df.loc[i,'LON']-.015,hom_df.loc[i,'LAT']+.007,hom_df.loc[i,'Community']+'('+str(hom_df.loc[i,'HI17'])+')',color='red', size=20)
        elif hom_df.loc[i,"Community"] in ["Burnside"]:
            plt.gca().text(hom_df.loc[i,'LON']-.02,hom_df.loc[i,'LAT']+.005,hom_df.loc[i,'Community']+'('+str(hom_df.loc[i,'HI17'])+')',color='red', size=20)
        elif hom_df.loc[i,"Community"] in ["East Side","South Deering"]:
            plt.gca().text(hom_df.loc[i,'LON']-.015,hom_df.loc[i,'LAT']+.004, hom_df.loc[i,'Community']+'('+str(hom_df.loc[i,'HI17'])+')',color='red', size=20)
        elif hom_df.loc[i,"Community"] in ["Riverdale"]:
            plt.gca().text(hom_df.loc[i,'LON']-.015,hom_df.loc[i,'LAT']+.005, hom_df.loc[i,'Community']+'('+str(hom_df.loc[i,'HI17'])+')',color='red', size=20)
        elif hom_df.loc[i,"Community"] in ["Norwood Park"]:
            plt.gca().text(hom_df.loc[i,'LON']-.024,hom_df.loc[i,'LAT']+.005, hom_df.loc[i,'Community']+'('+str(hom_df.loc[i,'HI17'])+')',color='red', size=20)
        elif hom_df.loc[i,"Community"] in ["East Garfield Park"]:
            plt.gca().text(hom_df.loc[i,'LON']-.015,hom_df.loc[i,'LAT']+.009,hom_df.loc[i,'Community']+'('+str(hom_df.loc[i,'HI17'])+')',color='red', size=20)

        else:
            plt.gca().text(hom_df.loc[i,'LON']-.02,hom_df.loc[i,'LAT']+.005,hom_df.loc[i,'Community']+'('+str(hom_df.loc[i,'HI17'])+')',color='red', size=20)

#plt.gca().set_facecolor('lightgray')
plt.gca().grid()
plt.yticks(fontsize=20)
plt.xticks(fontsize=20)
#title
plt.title('Homicide-Free Community Areas in 2017',size=25)
plt.xlabel("Longitude",size=30)
plt.ylabel("Latitude",size=30)
fig.savefig("Fig5revised.png")
#show the plot
plt.show()